Inline Viscosity Monitoring for Atomization Applications
Atomization is a process used to break up a liquid into fine droplets, usually done…

Mayonnaise quality is governed by its rheology, particularly viscosity and yield stress, which are shaped by formulation variables such as oil content, egg yolk concentration, and acidity. Manufacturers have long relied on offline rotational viscometry for viscosity quality control, a well-established but limited method that requires manual sampling, reflects only a single point in time, and cannot support continuous inline process control. The Rheonics SRV inline viscometer overcomes these limits by monitoring the product continuously within the process, enabling immediate detection of deviations and tighter batch-to-batch consistency.
Table of Content
Mayonnaise is an oil-in-water emulsion whose texture, stability, and processability depend on its rheology. Attributes like spoonability, spreadability, resistance to oil separation, and pumpability rely on viscosity and yield stress, controlled by formulation variables such as oil content, egg yolk, and acid concentration.
Because viscosity defines product quality, producers routinely measure it during production with a laboratory rotational viscometer. This offline method requires manual sampling and reflects the product only at sampling time and lacks repeatability for inline control of a fluid. Despite these issues, rotational viscometers are a well-established technology in mayonnaise production, used in Quality Control Labs for many years already.
Inline viscosity measurement overcomes these limits by continuously monitoring the product directly in the process. Real-time measurements let manufacturers detect process deviations immediately, improving batch consistency and control. The Rheonics SRV is an inline viscometer designed for this purpose.
Inline measurements will differ from lab readings at first due to different operational conditions and the non-Newtonian nature of most fluids. Given the trust customers have in rotational meters and QC regulations, they often search for a correlation between the SRV and offline rotational readings, which also allows them to reduce or eliminate the need for manual sampling. This study evaluates the relationship between Rheonics SRV and Brookfield viscosity measurements across a range of commercially representative mayonnaise formulations.
Note: The SRV main purpose is to deliver consistent and repeatable measurements. You can then decide whether to create a profile aligned with lab measurements (using scaling) or based only on SRV data. This video might help solve any additional doubts: This is how Rheonics SRV Inline Viscometer compares with other tools and adds precision to a process.
This study evaluates whether a reliable correlation can be found between Rheonics SRV inline viscosity readings and Brookfield laboratory viscosity measurements for mayonnaise across five commercially available products with a wide range of oil content and formulation types.
The specific objectives are:
Characterize each product’s viscosity profile using a Brookfield viscometer at multiple spindle speeds.
Quantify SRV reading repeatability across five sequential trials per product (CV: coefficient of variation).
Identify the Brookfield RPM with the most consistent measurements for proper linear correlation (R²) between mean SRV and mean Brookfield viscosity readings.
Determine if a single linear equation can reliably convert between the two measurement methods for different mayonnaise products.
Five commercial mayonnaise products were selected to represent a typical range of formulations within the category: a classic full-oil mayonnaise (Mayo 1, Heinz Original), an economy full-oil mayonnaise (Mayo 2), a premium French-style mayonnaise (Mayo 3), a reduced-oil (“light”) mayonnaise (Mayo 4), and a heavily reduced-oil (“extra-light”) mayonnaise (Mayo 5, 90% less oil). The composition information reported on each product’s label is summarized in Table 1.
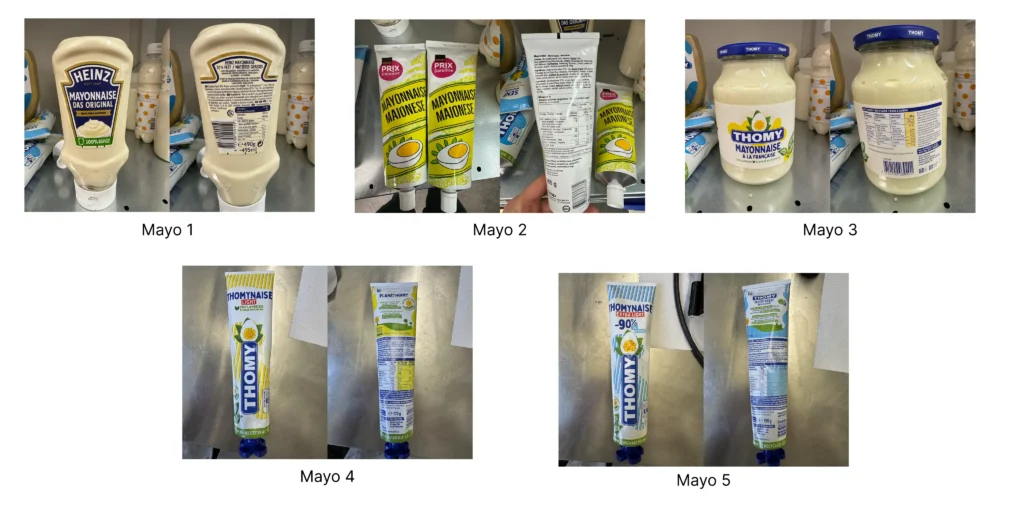
Figure 1. The five mayonnaise samples evaluated (Mayo 1-5), as supplied
Table 1. Label-declared composition and market positioning of the five mayonnaise samples.
|
Attribute |
Mayo 1 (Heinz Original) |
Mayo 2 (Store-brand) |
Mayo 3 (French-style) |
Mayo 4 (Light) |
Mayo 5 (Extra-light) |
|---|---|---|---|---|---|
|
Oil content |
68% rapeseed oil |
70% sunflower oil |
80% sunflower oil |
30% sunflower oil |
7% sunflower oil (-90% less oil) |
|
Egg yolk |
5% |
4.5% |
5% |
3.8% |
5% |
|
Acid type |
Spirit vinegar |
Table vinegar |
Table vinegar |
Table vinegar |
Table vinegar |
|
Carbohydrates /100g |
3.0 g |
2 g |
0.3 g |
4.5 g |
6.7 g |
|
Sugar /100g |
1.5 g |
0 g |
0.2 g |
0.7 g |
1.5 g |
|
Market positioning |
Premium / classic |
Economy |
Premium / artisanal |
Reduced-fat |
Reduced-fat (extreme) |
Measurements were performed using a Brookfield viscometer fitted with an LV4 spindle, taken at ascending and descending RPM steps, recording apparent viscosity and torque percentage at each speed. Data points where the torque display had not stabilized (flashing indicator = No) were recorded but flagged as less reliable.
Notes:
All measurements were conducted at a controlled temperature of 23.5 °C
Only data points with torque values between 20% and 80% were included in the analysis to ensure reliable viscosity measurements.
The LV4 spindle constant is 6,000, giving the factor relationship: Factor = 6,000 / RPM, and viscosity (cP) = Torque (%) × Factor.
Table 2. Brookfield viscometer test conditions (LV4 spindle)
|
Temperature (°C) |
Spindle |
Constant |
RPM |
K factor |
|---|---|---|---|---|
|
23.5 |
LV4 |
6000 |
1.5 |
4,000 |
|
23.5 |
LV4 |
6000 |
3 |
2,000 |
|
23.5 |
LV4 |
6000 |
6 |
1,000 |
Table 3. Brookfield viscometer test results (LV4 spindle)
|
Sample |
RPM |
Torque (%) |
Viscosity (cP) |
|---|---|---|---|
|
Mayo 1 |
1.5 |
29.2 |
116,800 |
|
Mayo 1 |
3 |
42.3 |
84,600 |
|
Mayo 1 |
6 |
55 |
54,990 |
|
Mayo 2 |
1.5 |
35.9 |
143,600 |
|
Mayo 2 |
3 |
51.8 |
103,600 |
|
Mayo 2 |
6 |
70.6 |
70,580 |
|
Mayo 3 |
1.5 |
46.5 |
186,000 |
|
Mayo 3 |
3 |
64.0 |
128,000 |
|
Mayo 3 |
6 |
87.2 |
87,080 |
|
Mayo 4 |
1.5 |
26.6 |
106,400 |
|
Mayo 4 |
3 |
33.3 |
66,600 |
|
Mayo 4 |
6 |
42.5 |
42,490 |
|
Mayo 5 |
1.5 |
50.8 |
203,200 |
|
Mayo 5 |
3 |
62.3 |
124,600 |
|
Mayo 5 |
6 |
74.2 |
74,180 |
Viscosity measurements were performed using a Rheonics SRV sensor connected via USB to a PC and logged using Rheonics Control Panel. For each product, the sensor was immersed in a sample cup, and five sequential measurement trials were performed,
Notes:
Each trial ran between 190 and 273 seconds. Updating reading at approximately 3s intervals
Ambient temperature varied between 23.5°C and 23.9°C for the first session (Mayo 1 to 3), and between 24.0°C and 24.5°C for the second session (Mayo 4 to 5).
|
Sample |
Trial 1 |
Trial 2 |
Trial 3 |
Trial 4 |
Trial 5 |
Viscosity (cP) |
CV |
|---|---|---|---|---|---|---|---|
|
Mayo 1 |
77.90 |
70.16 |
70.42 |
70.25 |
69.28 |
71.60 |
5.0% |
|
Mayo 2 |
71.42 |
71.28 |
71.40 |
72.39 |
70.54 |
71.41 |
0.9% |
|
Mayo 3 |
90.90 |
89.64 |
87.52 |
89.06 |
89.53 |
89.33 |
1.4% |
|
Mayo 4 |
61.11 |
55.96 |
56.88 |
56.30 |
55.36 |
57.12 |
4.0% |
|
Mayo 5 |
53.17 |
54.47 |
54.66 |
54.27 |
53.96 |
54.11 |
1.1% |
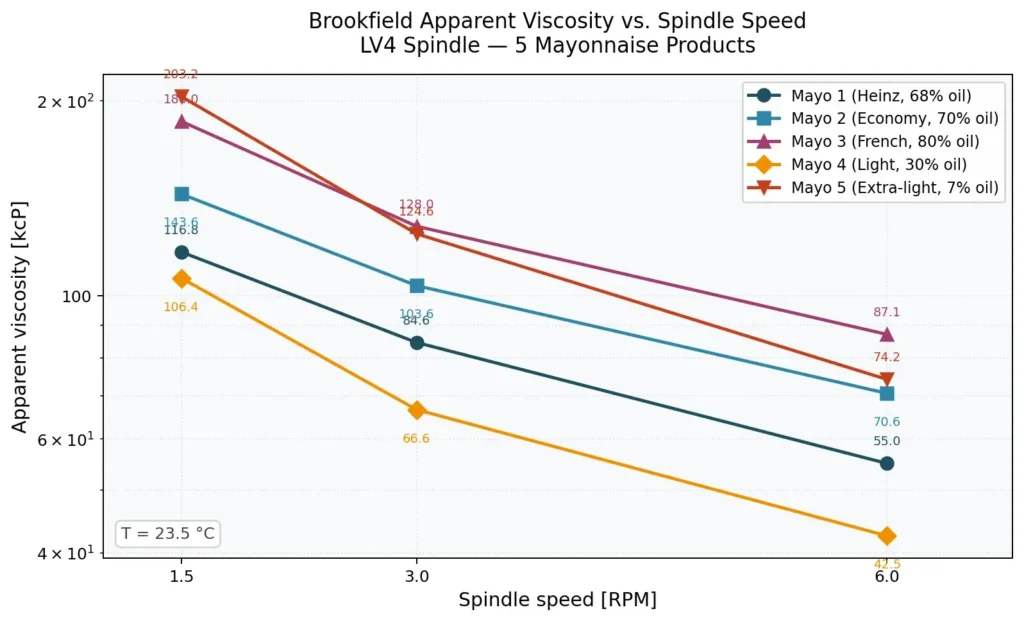
Figure 2 shows the mean Brookfield apparent viscosity at three selected RPM values for each of the five products. The three RPMs selected represent low, mid, and high shear conditions within the reliable torque range (flash stable = Yes). All five products exhibit strong shear-thinning behavior, with apparent viscosity decreasing by roughly an order of magnitude from the lowest to the highest RPM tested.
Figures 3 to 7 show the SRV viscosity measurements for all five trials on each product. The steady-state mean per trial and the grand mean across five trials are overlaid. For Mayo 1, Trial 1 consistently reads higher than Trials 2 to 5, attributable to the intact emulsion structure of an undisturbed sample; subsequent trials show a brief dip followed by thixotropic recovery. Within-trial precision (intra-trial SD [standard deviation]) is below 0.15 cP for all Mayo 1 trials, confirming excellent sensor stability.
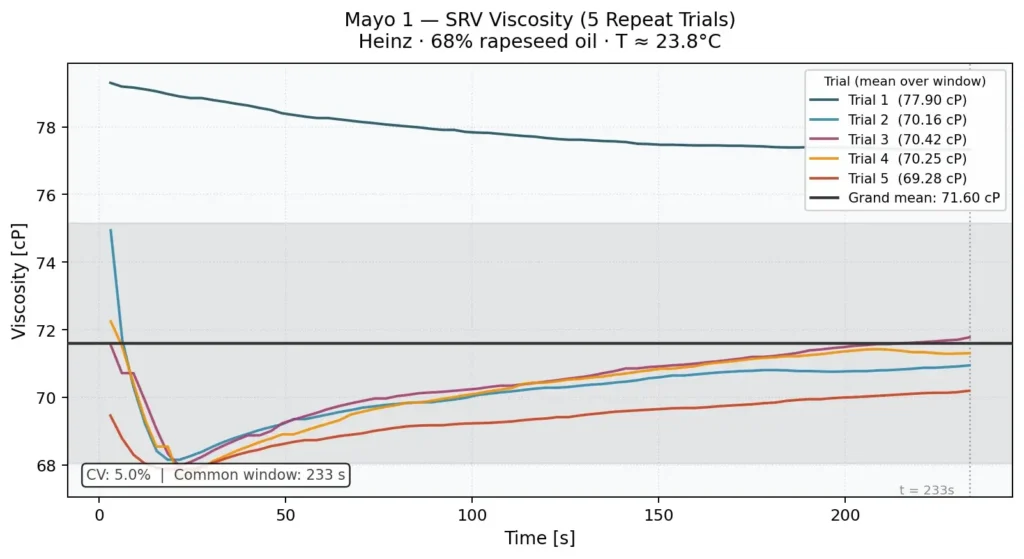
Figure 3. Mayo 1 SRV readings
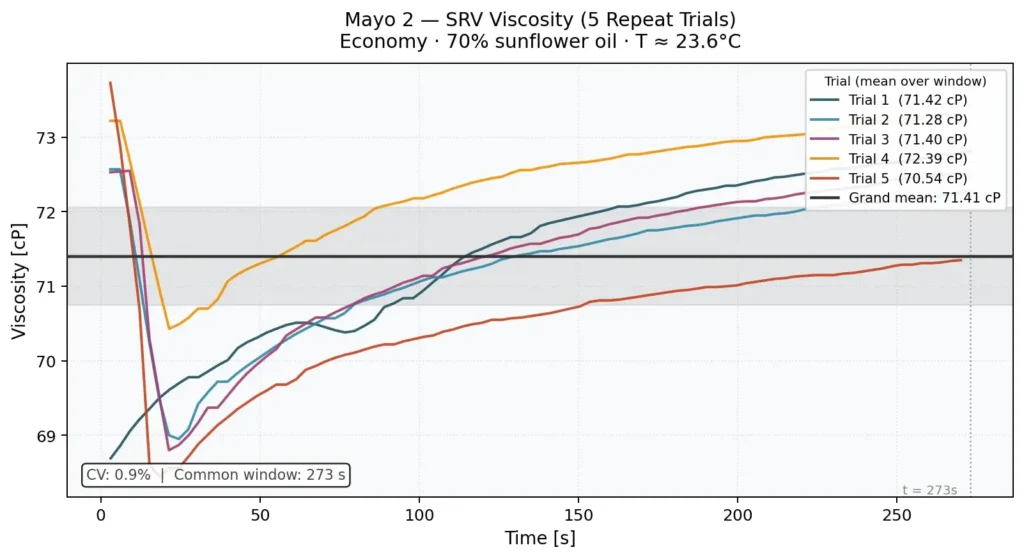
Figure 4. Mayo 2 SRV readings
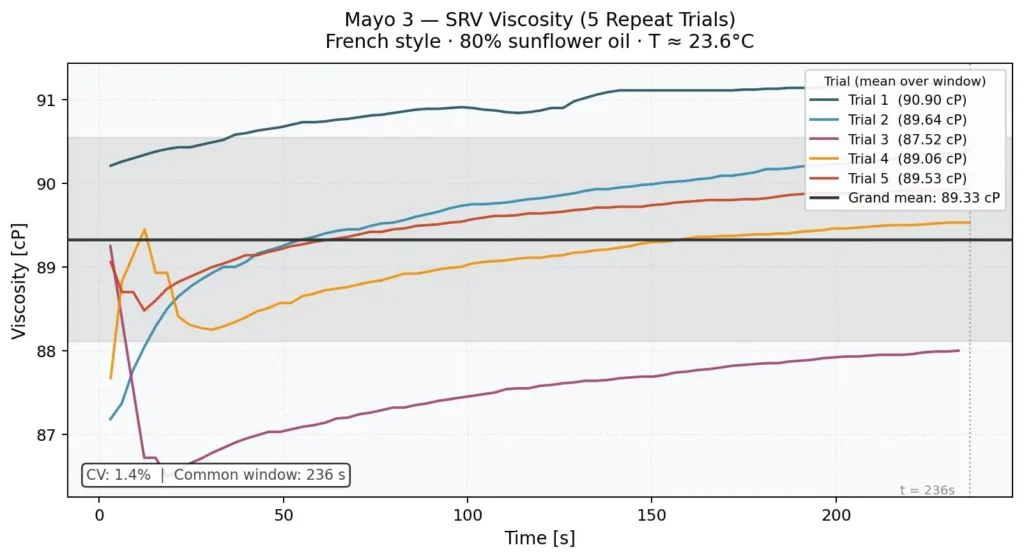
Figure 5. Mayo 3 SRV readings
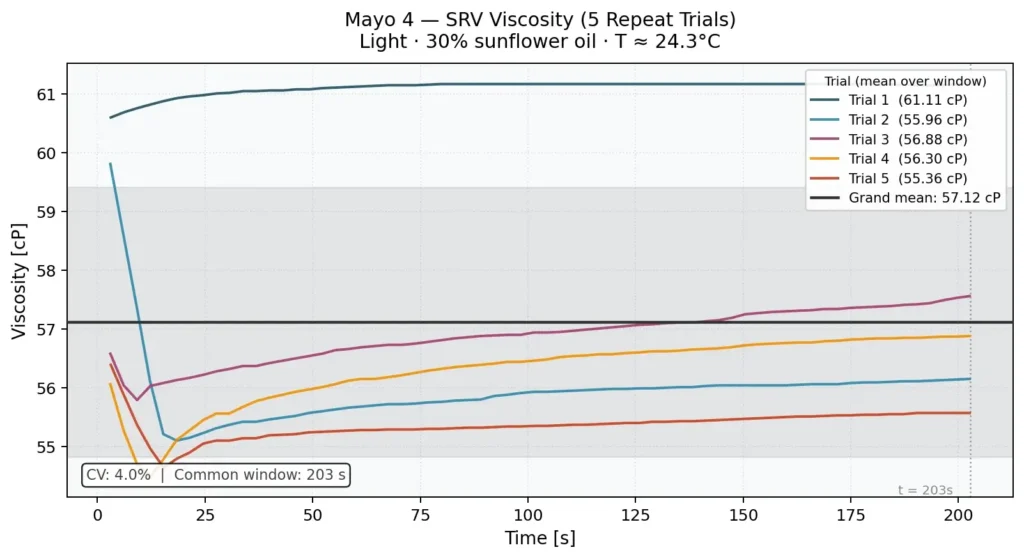
Figure 6. Mayo 4 SRV readings
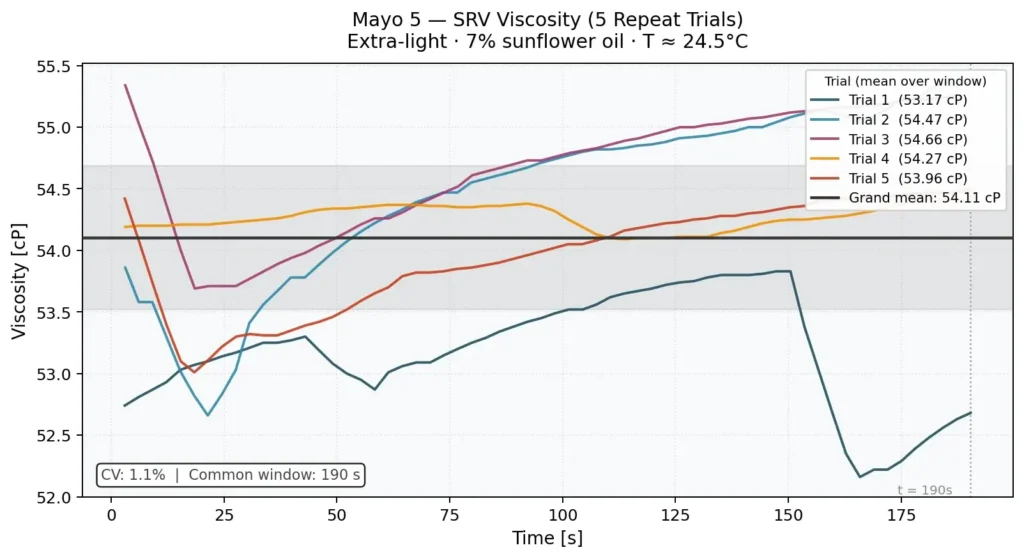
Figure 7. Mayo 5 SRV readings
As shown above, Mayo 1 and Mayo 4 exhibit the same trend during Trial 1, which is significantly higher than Trials 2 to 5. The most likely explanation is thixotropic structure recovery.
When the mayonnaise rests, its emulsion network rebuilds into a fully structured gel. The first SRV measurement encounters this intact structure, resulting in the highest viscosity reading. Subsequent immersions disturb the local structure, and although partial recovery occurs between trials, the sample does not fully rebuild within the short interval.
This behavior explains why Mayo 1 and Mayo 4 show the highest coefficients of variation (CV). However, their CV values remain within an acceptable range. In an inline process, this effect is expected to be minimal, as continuous flow maintains the product under constant shear, preventing full structural recovery.
Note: We could remove Trial 1 from a real on-site test, but we kept it to show what can happen under real-world conditions.
Figures 8 to 13 present the main study results. Each point represents one product, plotting mean Brookfield viscosity (X-axis) against the SRV grand mean viscosity (Y-axis). The analysis was performed six times: once for each Brookfield RPM (1.5, 3.0, and 6.0) using all five products (Figures 8 to 10), and repeated excluding Mayo 5 (Figures 11 to 13), which significantly improved the correlation.
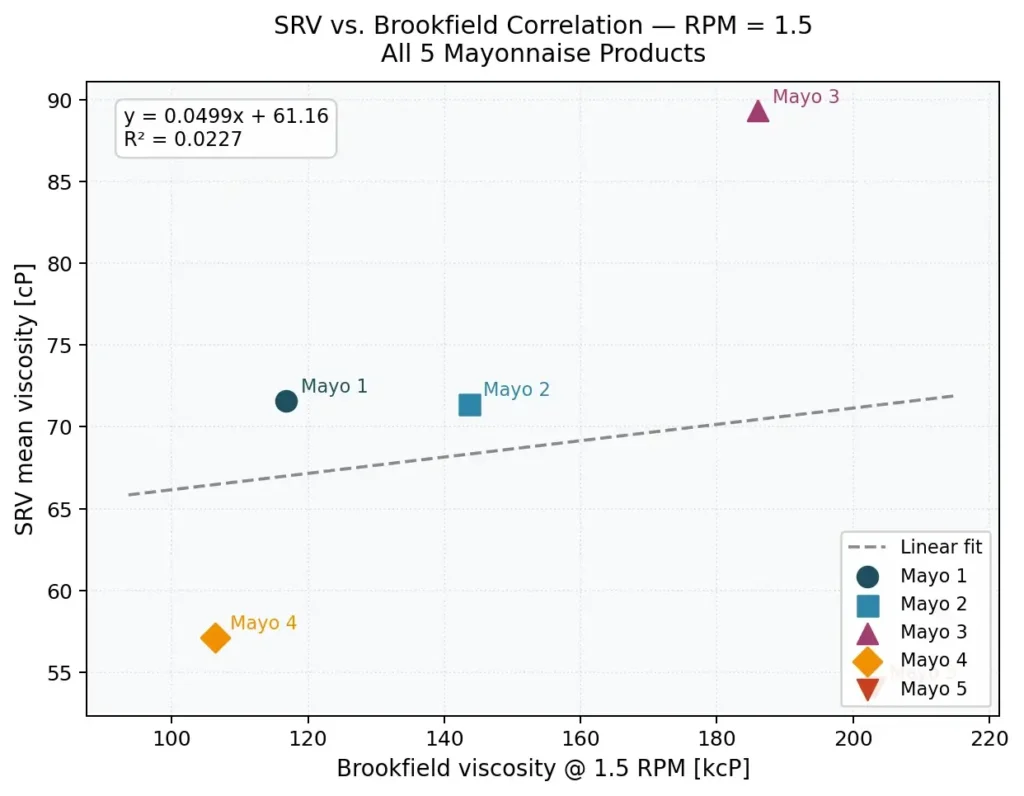
Figure 8. All five products Linear Correlation at 1.5 RPM
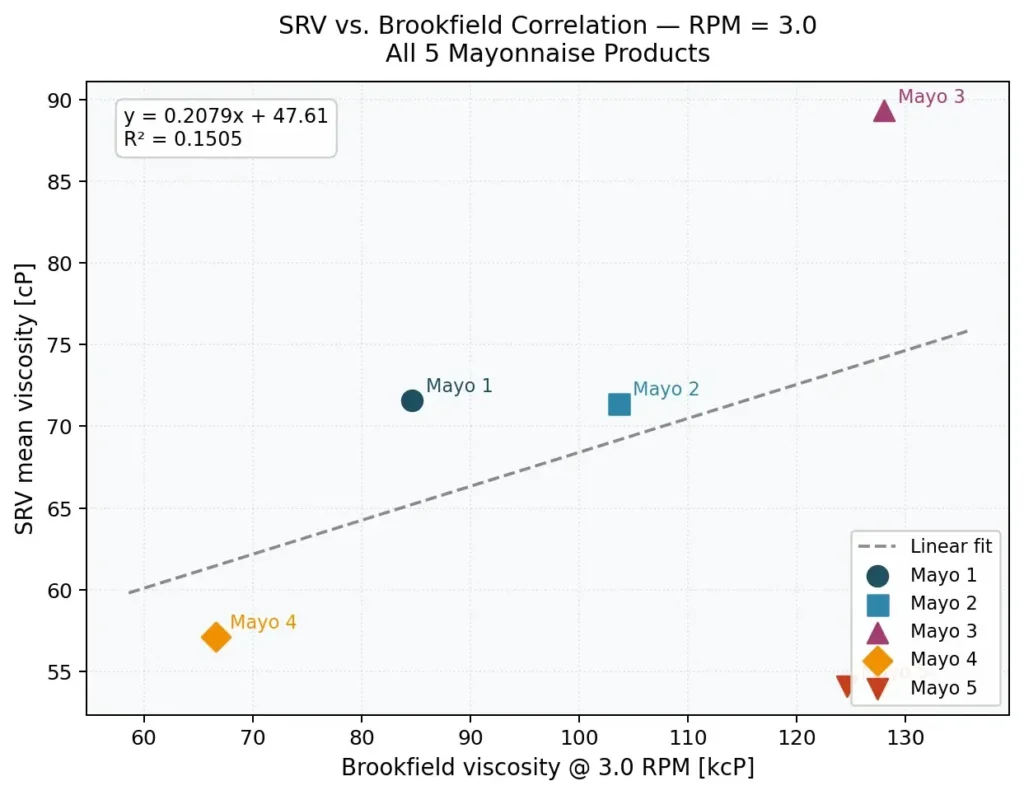
Figure 9. All five products Linear Correlation at 3 RPM
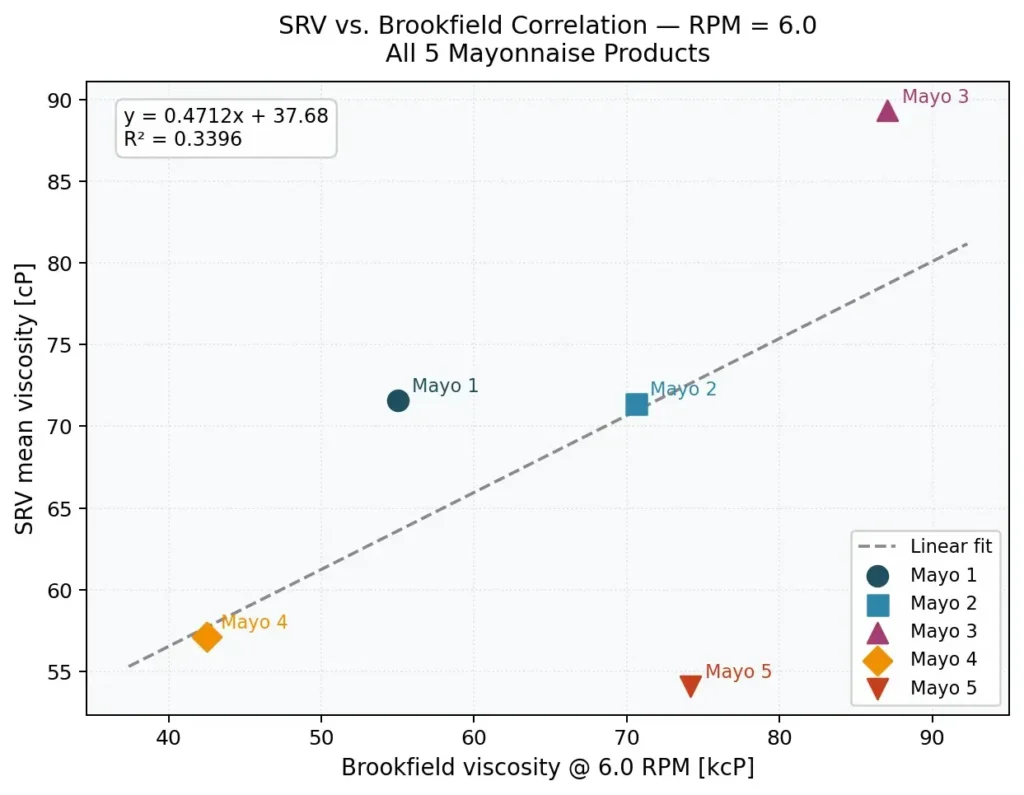
Figure 10. All five products Linear Correlation at 6 RPM
As shown in the first three plots above, when all five products are included, R² values drop to 0.023, 0.151, and 0.340 at 1.5, 3.0, and 6.0 RPM, respectively. Far too low to serve as a reliable empirical model, since Mayo 5 prevents a meaningful linear correlation across all five products. The analysis was therefore repeated excluding Mayo 5.
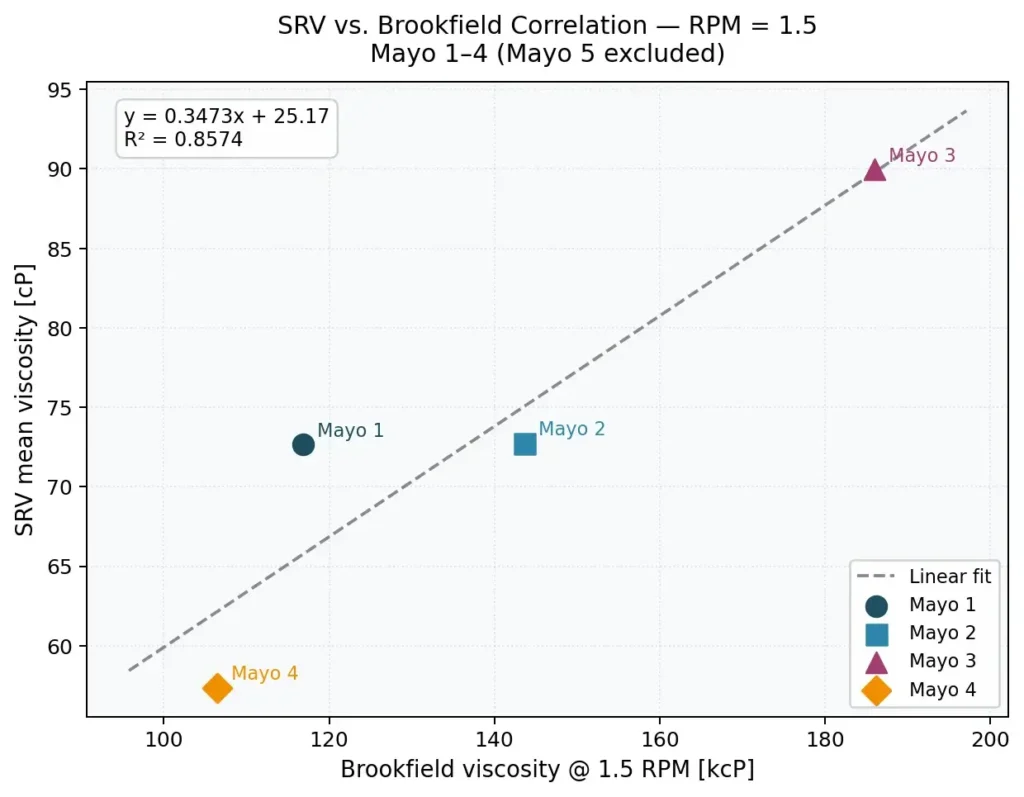
Figure 11. Excluding Mayo 5 Linear Correlation at 1.5 RPM
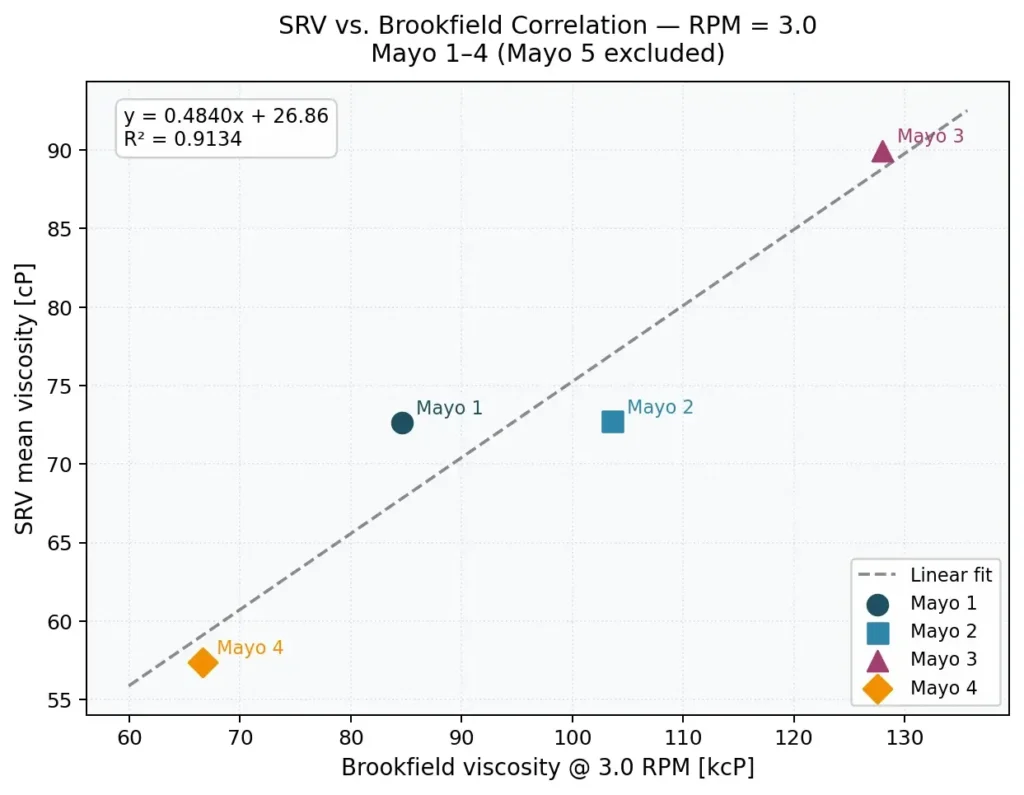
Figure 12. Excluding Mayo 5 Linear Correlation at 3 RPM
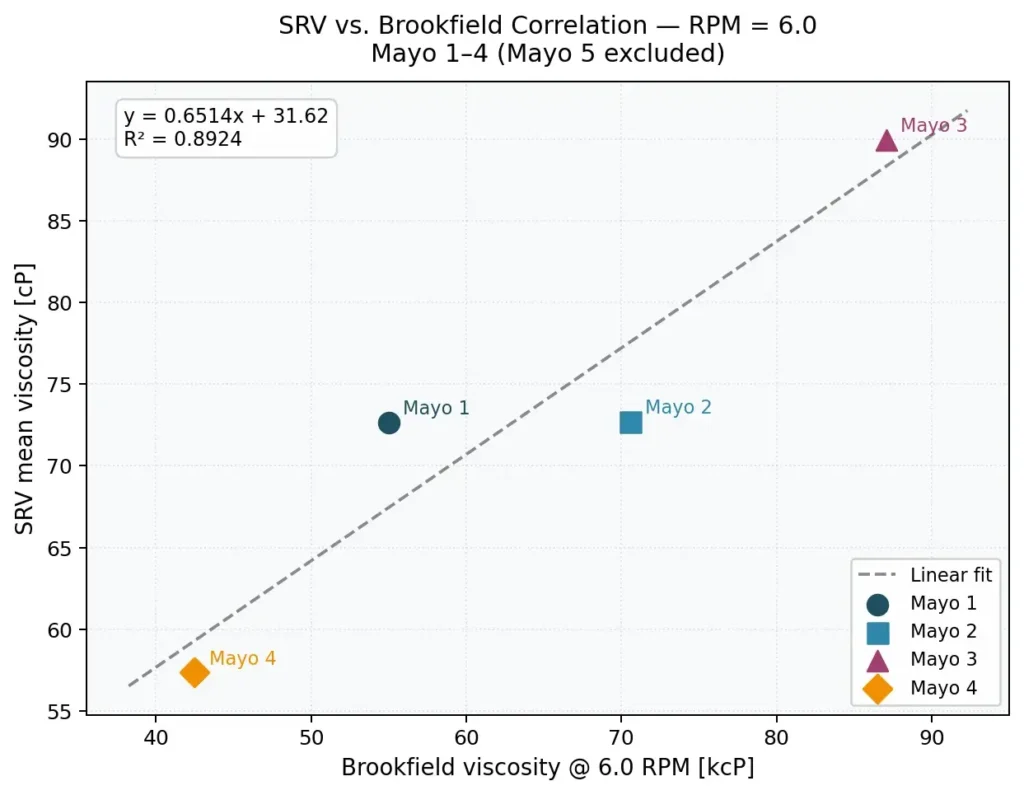
Figure 13. Excluding Mayo 5 Linear Correlation at 6 RPM
Excluding Mayo 5 significantly improves the correlation. The resulting R² values are 0.865, 0.910, and 0.888 at 1.5, 3.0, and 6.0 RPM, respectively.
The strongest correlation is obtained at 3.0 RPM (R² = 0.910) and can be correlated with SRV using the following linear equation:
SRV (cP) = 0.4782 × BF₃.₀ (kcP) + 26.60 (R² = 0.910)
For implementation in RCP, the equation should be rearranged to express Brookfield viscosity in terms of the SRV reading. Therefore:
All products showed shear-thinning behavior, with viscosity decreasing as spindle speed increased. Mayos 1 to 3 had higher viscosities than the reduced-fat products. Mayo 5 (7% oil) showed the highest Brookfield viscosity at all RPMs.
SRV repeatability was good for all products. Mayo 2, 3, and 5 had CVs between 0.9–1.4%, while Mayo 1 and 4 showed higher variability (5.0% and 4.0%) because the first measurement was consistently higher than the rest, likely due to thixotropic structure recovery. For inline applications, a stabilization period of at least 60s after probe insertion is recommended.
Among the conditions tested, 3.0 RPM provided the best correlation with SRV measurements (R² = 0.910), followed by 6.0 RPM (0.889) and 1.5 RPM (0.865).
The strongest correlation is obtained at 3.0 RPM, excluding Mayo 5 (R² = 0.910). For RCP implementation, the scaling coefficients are C1 = 2.090 and C0 = −55.62.
This correlation is valid for mayonnaise containing 30–80% oil at 23.5°C using an LV4 spindle. Mayo 5 (7% oil, hydrocolloid-thickened) does not follow this relationship and requires a separate correlation model.
Atomization is a process used to break up a liquid into fine droplets, usually done…
Mayonnaise, a globally enjoyed condiment, is a classic oil-in-water emulsion, distinct from water-in-oil emulsions like…
For process engineers, it's essential to develop an efficient and reliable method to monitor and…
The process of converting liquid milk into dry powder involves removing most of the water…
Texture and product consistency are of utmost importance to customer - in manufacturing, viscosity is…
Key advantages of viscosity management in mixing applications: Accurate and efficient mixing operations – significant…