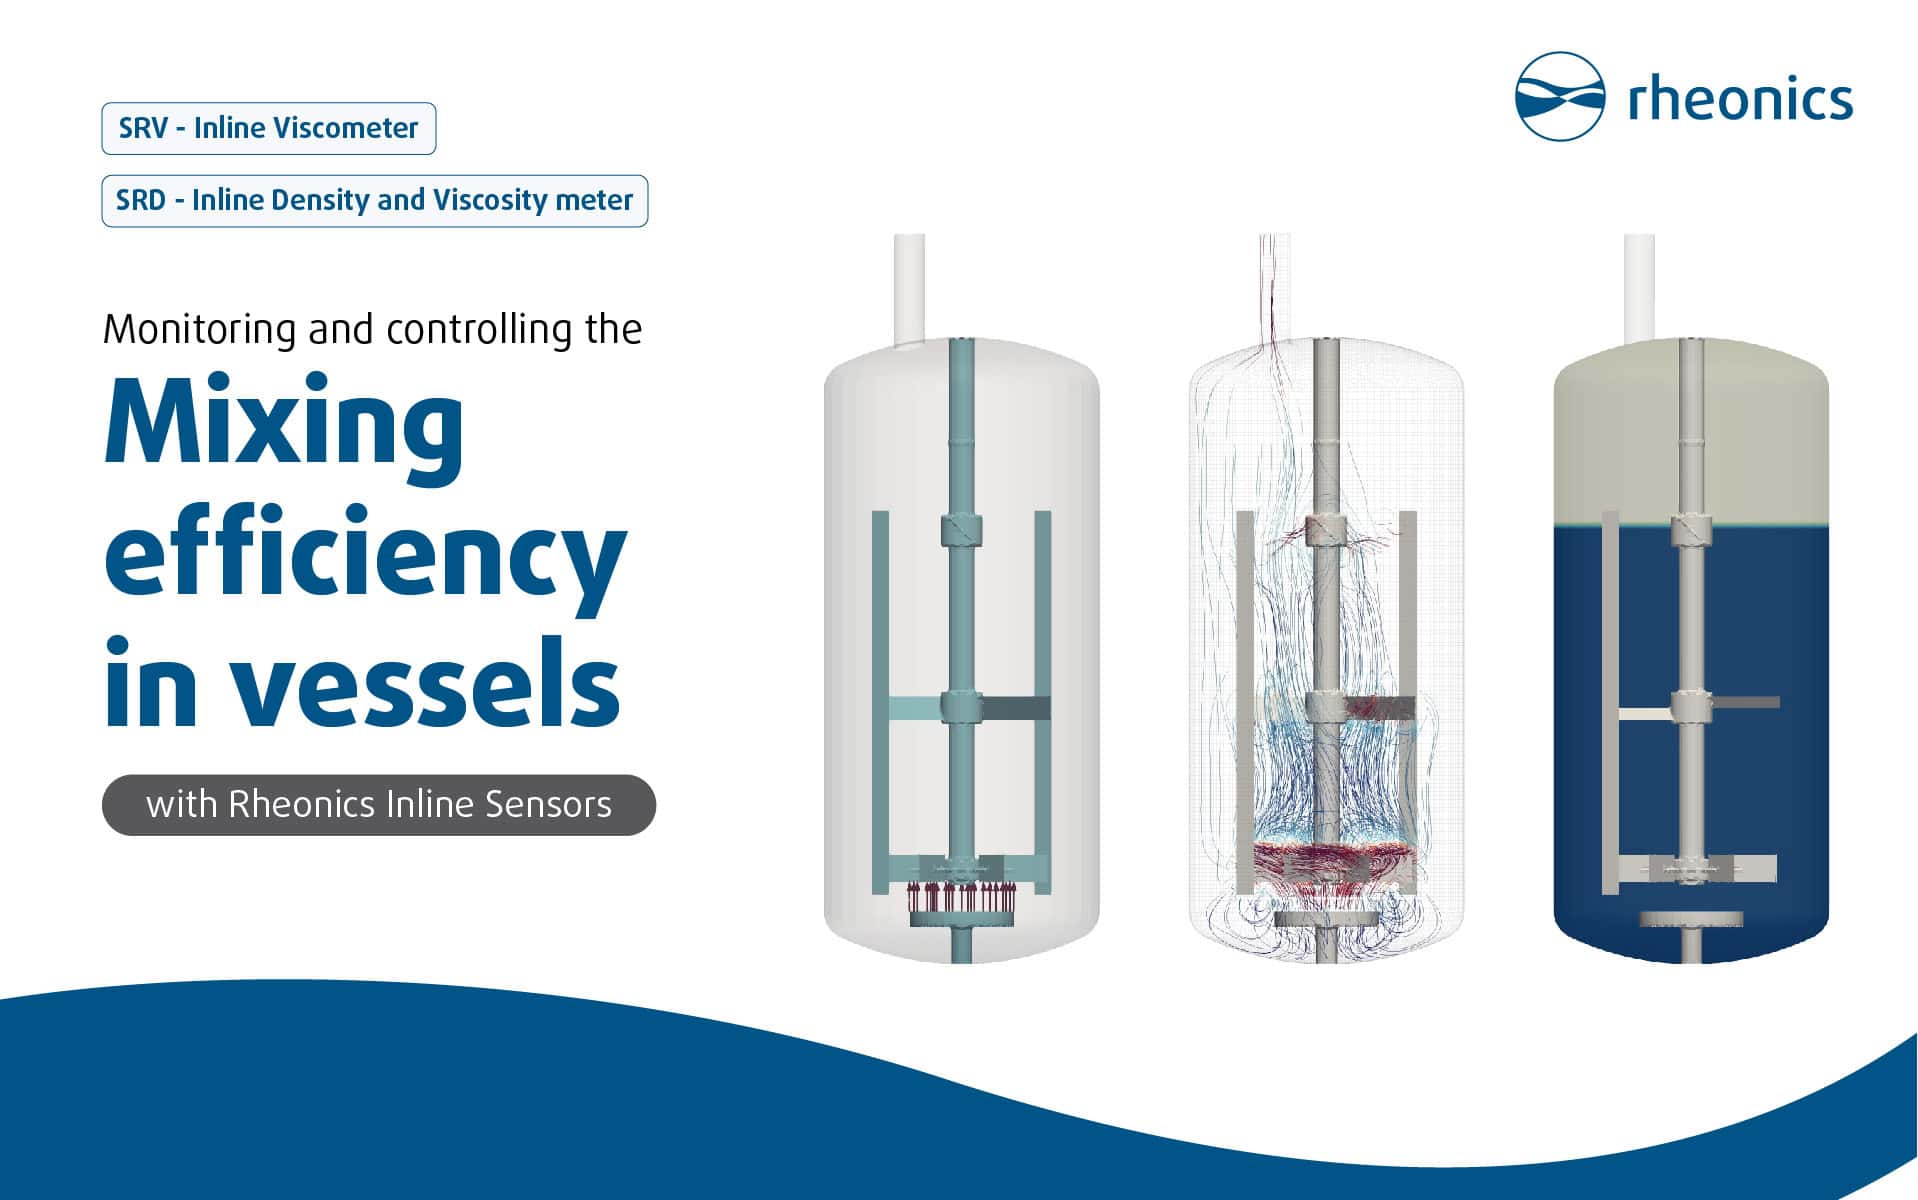
Real-time viscosity development during mixing and end-product detection
Rheonics process viscometer SRV or Rheonics process density and viscometer SRD can be installed in a variety of locations in the manufacturing process. Using the sensor in the vessel can benefit production primarily by watching viscosity change as the mixing process progresses. Seeing viscosity during mixing allows the operator to optimize and avoid overmixing or time-dependent product degradation. This allows energy and time savings as the operator can see definitively when the end-product has been reached. This can be seen in the sample SRV data in Figure 1 as the measured viscosity reaches a desired setpoint range (green).
Monitoring homogeneity and uniformity of mixing
Secondarily, noise in viscosity measurement during mixing can indicate inhomogeneity. Figure 1 shows sample SRV data where the noise in the data reduces as mixing progresses, then after setpoint is reached, continues to reduce until the process liquid viscosity noise is staying within the tolerance (green region). Therefore the SRV readings from mixing vessels can indicate the quality of the mixing and subsequently, quality or lifetime of the slurry as over processing can lead to slurry degradation.
Detecting mixing issues
Finally, sensor installation in a mixer allows the detection of build up of agglomerates, bubbles or other artifacts in the tank. Deviations from the process envelope can indicate clumps and bubbles. Deviating above generally indicates solid artifacts, and deviations below indicate bubbles. (No deviations of this sort are shown in this sample dataset.)
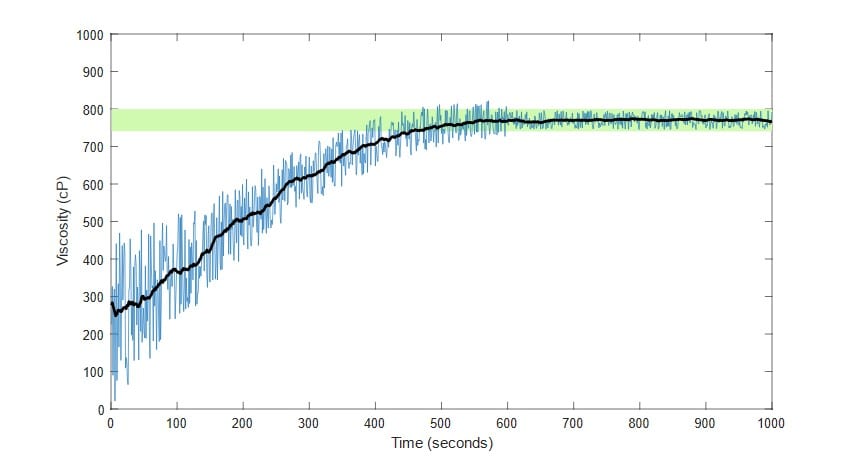
Figure 1: Sample process data from SRV in mixing vessel. Green indicates setpoint and tolerance region. Blue is individual viscosity measurements. Black is smoothed viscosity data.
Continuous vs. Intermittent measurements
The use of viscosity sensors in mixing vessels can be done continuously or intermittently. While the maximal information can be obtained from installing the probe full-time in the mixing vessel, there are use cases that demand periodic sampling.
Continuous monitoring of mixing process
This option is the easiest option for most situations and gives the operator the most information. The quality control benefits of this option are two-fold: 1) ongoing measurements that can be compared to off-line measurements at any time point: reducing the need for off-line measurements and 2) any potential issues can be immediately detected. Process control based on continuous viscosity measurement with the SRV can be tightly controlled to prevent viscosity overshoots that could spoil a batch or a segment of a continuous process. With data from the entire processing time, the mixture properties can always be known and the system is hands-off.
Intermittent monitoring of mixed product
In some processes, it is desirable to perform intermittent measurements with the SRV in the mixing vessel. Reasons for this can include: carefully prescribed fluid flow patterns that can be disrupted by even a small sensor; inability to install a sensor in the mixing vessel (when blades are scrapping all surfaces and mounting from lid is not possible); high bending force on sensor (high viscosity fluids – solutions exist in Rheonics portfolio for high viscosity mixing); cleaning needs (product buildup on sensors); impact reduction (multiphase processes with large aggregates); or industry standard protocols. When intermittently monitoring, it is important to note measurement time, whether flowing or static environment, and care must be taken to insert the probe in the same flow region when comparing flowing environment measurements.
Install locations
Installation of Rheonics inline viscometer can be done from lid, side, bottom, or in a recirculation line. The table below clarifies which mixing situations lead to the recommendation of each.
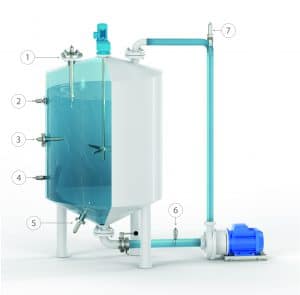
Figure 2: Mixing tank installation locations (see Table 1 for location choice tips).
Product information for each install location is found here: Rheonics inline viscometer and density meter in tank and recirculation line for mixing processes. Further, when doing intermittent testing, inserting the probe from the top is often the most practical choice as it is installable/removeable during the mixing process.
Table 1: Zoomed-in views and recommendations for the sensor positions from Figure 2.
| Zoom-in view | N° | When to use | Drawbacks |
|---|---|---|---|
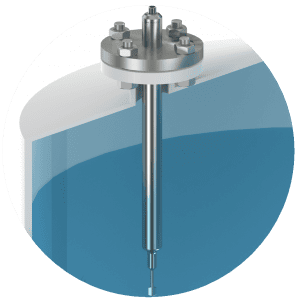 | 1. Long insertion from the top | Mixing rotor is in bottom and scrapes sides. Damaging aggregates with higher density than fluid. | Tank level variability, if batch and the process fluid is being reduced over time. |
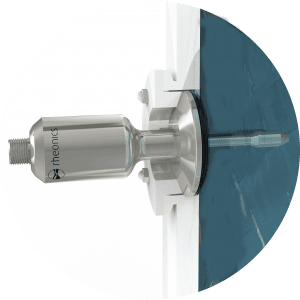 | 2. Flush installation | Allows large mixing rotor, great for low viscosity fluid without wall adhesion. Hygienic design compatible. | Cleaning or mixing procedures that involve wall scrapers. |
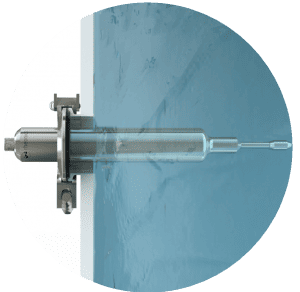 | 3. Long Tri-Clamp insertion on wall | Puts probe into the best mixed areas in fluids with wall effects like adhesion and boundary layers. | Smaller rotor needed to use long probe at rotor height. Sensor is more prone to damage when removing rotor or other components from tank. |
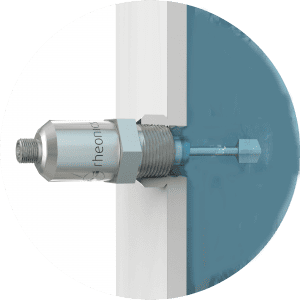 | 4. Threaded installation on wall | Ideal when tank already has NPT threaded ports. | Not always hygienic. can have build up around top of sensing area if Weldolet is too long. |
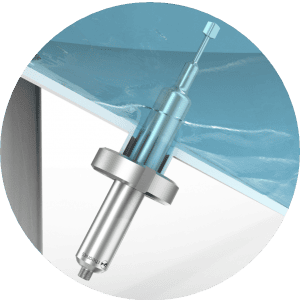 | 5. Long installation from bottom | When concerned about density gradient or incomplete mixing. Desired to detect solid clumps that have sunk. | If solid clumps are large and heavy enough, this position is vulnerable. Can also cause cleaning challenges. |
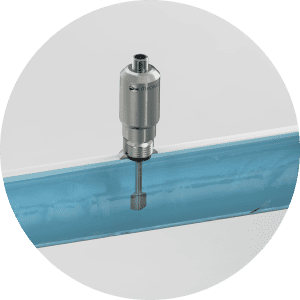 | 6. Threaded installation in pipe | If reactor has prescribed flow patterns that should not be disrupted in mixing vessel itself. | Pipe size must be considered. When no recirculation line, this can only be a ‘check’ after the product is already in motion to the next unit operation. |
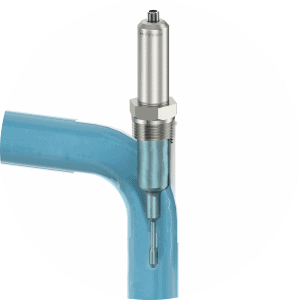 | 7. Long insertion threaded installation in pipe elbow | Narrow pipes, 2” and below. Allows probe in flow-field without concerns of build up. Doesn't need to be a bend at the top of a pipe. Great for materials that tend to solidify on equipment. | Requires a bend. When no recirculation line, this can only be a ‘check’ after the product is already in motion to the next unit operation. |
Figures 3, 4, and 5 demonstrate specific mixing tank installations with a central rotor mixer in Figure 3 and a high speed mixer with a scraper in Figure 4. In Figure 5, a set up for intermittent testing is shown. This is by no means a complete list but provides a few common mixing vessel installations.
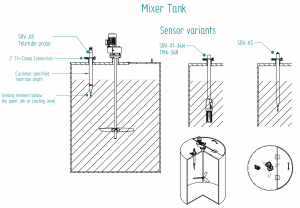
Figure 3: Installation in mixing tank
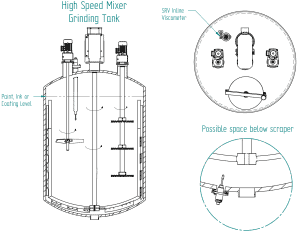
Figure 4: Installation in high-speed mixer dissolver.
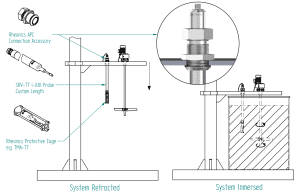
Figure 5: Installation of an intermittent monitoring system where probe can be lowered into the mixer when required.
Process Control and Automation
Having full knowledge of the mixing progress and homogeneity of the system from monitoring real-time viscosity measurements presents the opportunity to incrementally adjust your input fluids to adapt to the conditions. After long-term use, a process engineer can build an expected process envelope, see Figure 6, around the data found in prior runs by the sensor. This expected envelope allows operators to know if viscosity is developing normally and allows adjustments to be made if concerns arise without waiting for complete mixing. This helps to catch raw material differences early on. In the example shown in Figure 6, the viscosity develops over a 10 hour mixing time. The current run is shown in blue and one can be alerted that the current run is proceeding abnormally at only a few hours which allows the operator to make early adjustments and save hours worth of processing time.
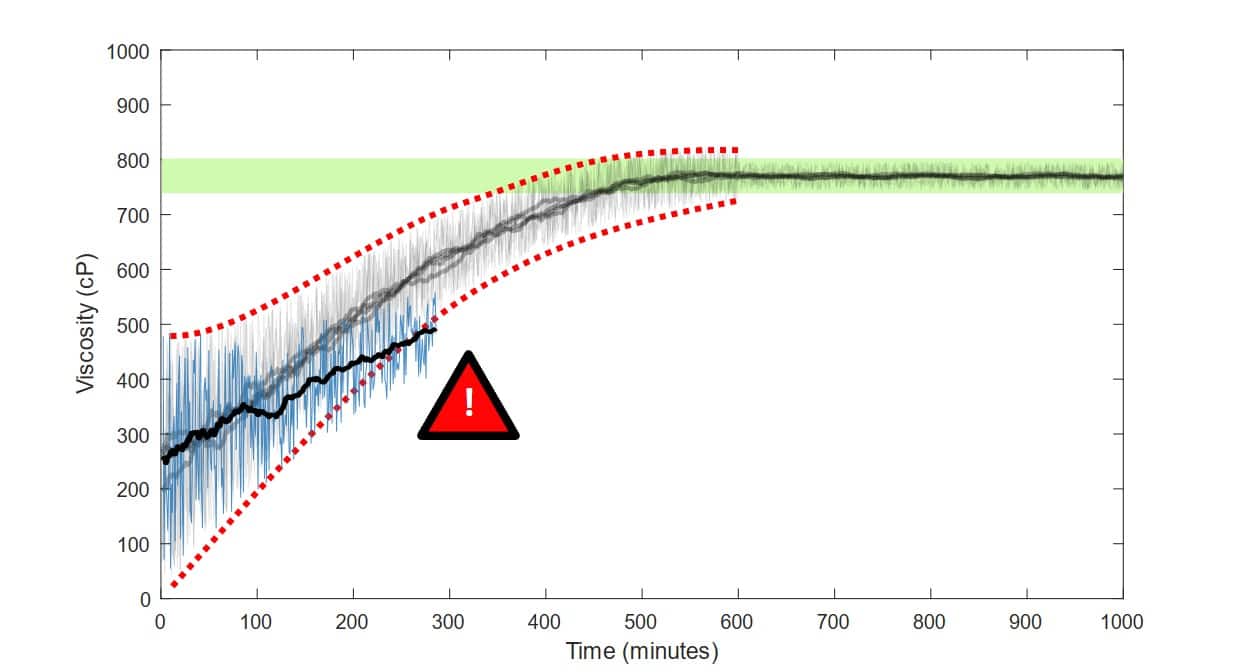
Figure 6: Dotted red lines form the expected process envelope. Former runs and their averaged values are seen in gray. The setpoint with a given tolerance is shown by the green region. For the current run (blue), the abnormal viscosity development can already be detected at 200 minutes.
Impact of viscosity on mixing speeds
Viscosity readings change with flow rate for non-Newtonian shear sensitive fluids, and increasing viscosity can reduce flow rate with the same amount of mixing. This should be considered when interpreting your results.
Continuous Quality Control
Data on current conditions in the tank and their relation to the resulting product, can give operators confidence that off-line checks will pass quality control, and ultimately allow operators greater confidence in the final products also have consistently correct properties. The inclusion of data points acquired from standard quality control measurements (e.g. Brookfield, Zahn, or other manual tests) can help operators see how deviations in these measures correlate with changing SR-Sensor readings. As the SR-Sensors are non-intrusive to the process, the manual tests can continue to be made as usual, and a empirical correlation between the manual test and SR-Sensor viscosity can be made. Such a correlation will have to be unique to each fluid being produced. Optimally, a deviance in the SR-Sensor viscosity can even alert operators to the need for a manual Quality Control test (Event-triggered tests).
Choosing which SR-Sensor
For both SR-sensors the process requirements need to be heeded for explosion safety, hygienic safety, food safety, and Clean in Place (CIP). When explosion safety certifications are required Rheonics offers ATEX and IECEx Certified SR-Sensors. For hygienic and food/pharmaceutical safety EHEDG Certified SR-Sensors from Rheonics are recommended. Once installed, the SR-Sensors can be used to indicate cleanliness of a process line and Optimize Clean in Place (CIP) Systems and with 3-A certified Rheonics SR-Sensors you can be sure to maintain full compliance with CIP sanitary standards in your process. If the sensors must be removed for cleaning (e.g. pigging) the Retractable SR-Sensors can be used. The SR-Sensors have zero maintenance, no moving parts, a metal-metal seal, and no polymer needed for operation making them an easy addition to any process to improve control and quality.
For choosing between SRD and SRV in mixing vessels, an SRD gives users additional information on their process, namely, the fluid density beyond the viscosity and temperature measured by SRV. Since density and viscosity are physically related properties, the density can provide early insight to an unexpected viscosity increase. However for SRD measurements bubbles, low speed, and large blobs in the system can increase noise in the readings. Therefore, if there is a large amount of noise in the data when an SRV is used, an SRD is not recommended and one should continue to use the SRV.
The process connection of either sensors is customizable to your process. Flush, short, and long probes and various process connections are available and can be explored here: SRV and SRD Installation.
References
- Rheonics SRV » inline online Viscometer for fluid viscosity monitoring
- Rheonics SRD » Density Meter inline online specific gravity concentration
- ATEX – IECEx Certification » rheonics :: viscometer and density meter
- 3-A certified Rheonics process viscometer and density meter » rheonics :: viscometer and density meter
- Rheonics EHEDG certified inline viscosity and density sensors for food and pharmaceutical applications » rheonics :: viscometer and density meter
- What is CIP? Optimizing CIP (Clean In Place) Systems with inline viscosity & density measurements » rheonics :: viscometer and density meter
- SRV Viscometer Installation
- Retractable Density Meter and Viscometer – Type SR-X5 and X8


