Enhancing Safety and Process Control in Combustible Dust Environments with EX Certified Rheonics Density Meters and Viscometers
Combustible dust poses a significant explosion risk across industries such as food processing, chemicals, mining,…
In battery manufacturing, viscosity and density play a critical role in achieving consistent slurry quality, optimizing performance, and improving the overall lifespan and recyclability of batteries. Rheonics inline sensors offer powerful tools for real-time process control and automation at every key stage of battery slurry preparation and coating.
Table of Content
Batteries play a central role in modern life—powering smartphones, electric vehicles, and renewable energy systems. As battery demand grows, the need for high-quality, efficient, and safe production methods becomes increasingly important. One of the most critical steps in battery manufacturing is ensuring consistent and accurate formulation of the anode and cathode slurry.
Even small variations in slurry properties can lead to defects that reduce performance, shorten battery lifespan, and increase environmental impact. Monitoring viscosity and density throughout the production—especially during electrode manufacturing— significantly improves final product quality and production efficiency.
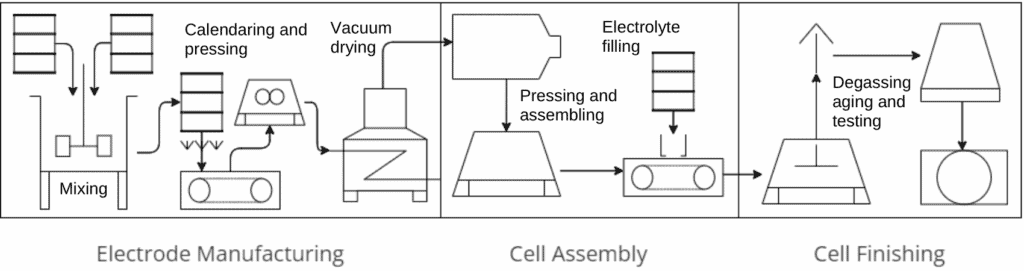
Battery production is typically divided into three main stages:
Each stage involves several unit operations, but the electrode manufacturing stage is where consistent quality must be ensured early on. Battery cells are built from stacks of coated electrode sheets—so the performance of the entire cell depends on the quality of each individual sheet.
The process begins with the preparation of the battery slurry, a mixture of active material, binders, conductive additives, and solvents. Cathode and anode slurries differ in formulation, but both require homogeneity and stability.

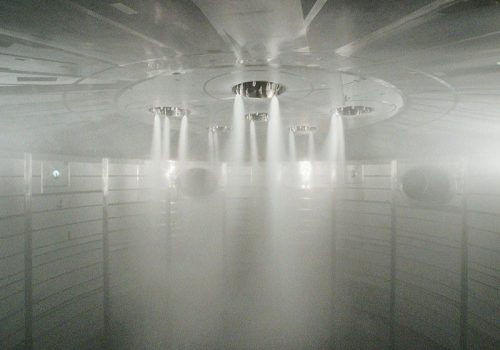
Slurry mixing takes place in large vessels where variables such as temperature, mixing speed, blade design, and atmospheric conditions, all affect final quality. After mixing, the slurry is transferred (via piping or sealed tanks) to the coating station, where it’s applied onto metal foils that are then dried and processed into electrode sheets.

According to the report by RWTH Aachen [1], key factors that determine slurry quality include:
Maintaining these parameters within strict tolerances is essential for producing uniform high-performance batteries. Rheonics inline sensors enable this by providing continuous, real-time viscosity and density monitoring—eliminating delays from offline sampling and allowing immediate corrective action.
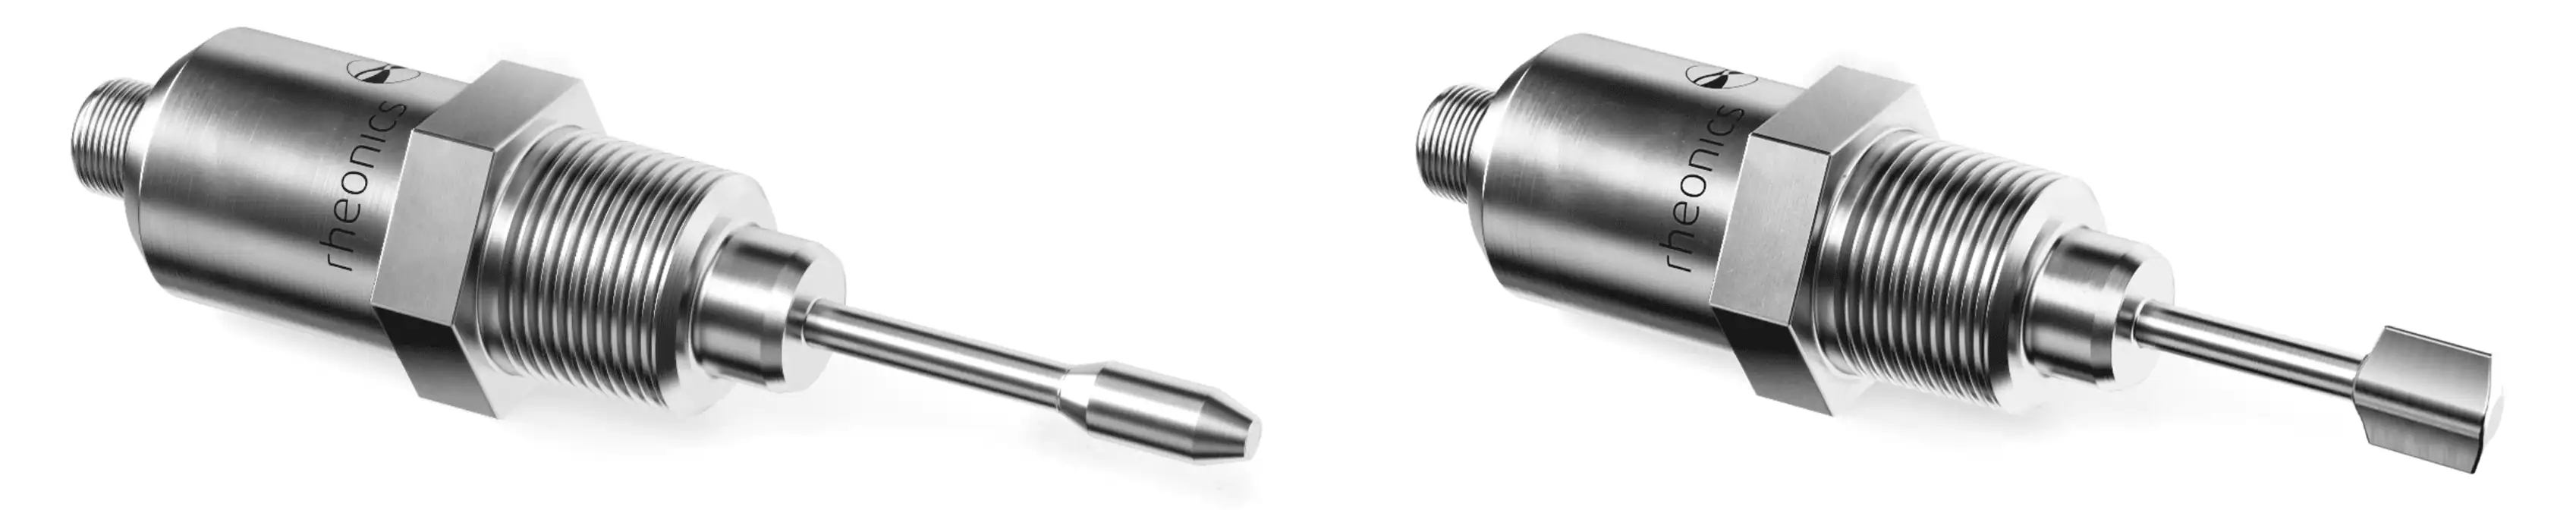
Rheonics offers two advanced inline sensor types tailored for battery slurry and electrolyte applications:
Both sensors are designed to withstand challenging industrial conditions and deliver accurate, reliable measurements directly in the process line or tank.
Key benefits:
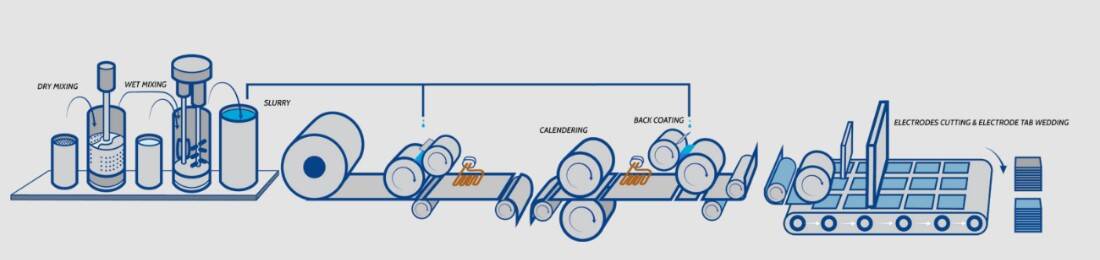
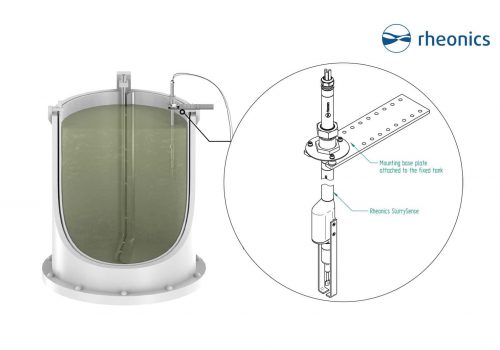
Rheonics sensors can be installed at multiple key stages in the battery slurry and coating process:
Rheonics sensors operating in a non-Newtonian fluid-like battery slurry will most likely not give the same viscosity reading as a laboratory viscometer like rotational meters, as technologies operate at very different shear rates. Rheonics SRV and SRD are predominantly process control instruments. From their readings, the smallest deviations from the baseline in production can be detected, which make them ideal for process monitoring and control.
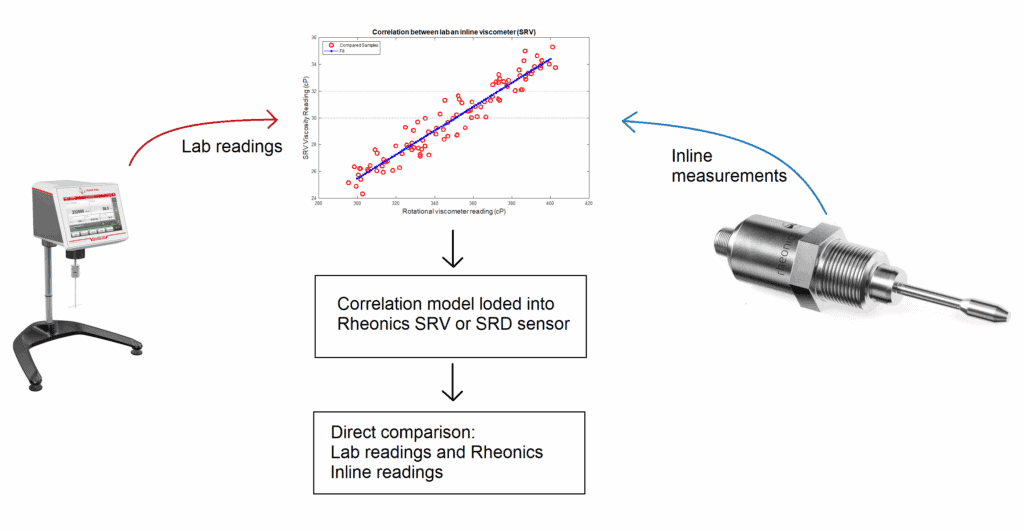
However, if alignment with lab readings is required, it’s possible to create a correlation model that transforms inline readings to match lab results. This model can be uploaded to the sensor firmware for real-time adjusted output.
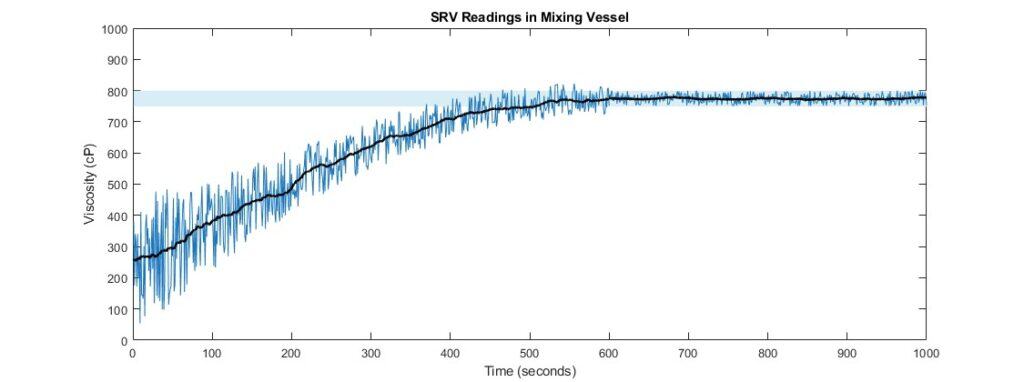
Using Rheonics sensors in mixing tanks give very insightful information about the process, the fluid composition change and the overall process performance. However, mixing processes can also induce noise in readings, predominanly in viscosity. This noise can also be representative of the process evolution, as the reduction in measurement noise as the process reaches the setpoint viscosity is an indicator of the homogeneity of the system. Later deviation from the setpoint tolerance envelope can indicate artifacts, bubbles, or aging in a slurry. Ensuring viscosity and density remain in the setpoint envelope is an excellent way to confirm the end product is meeting the composition and consistency targets for quality control.
Real-time viscosity and density data provide deep insights into slurry behavior:
[1] LITHIUM-ION BATTERY CELL PRODUCTION PROCESS. https://www.pem.rwth-aachen.de/global/show_document.asp?id=aaaaaaaaabdqbtk
[2] Battery Materials. https://www.freemantech.co.uk/applications/battery-materials
[3] Electrolyte Filling of a Lithium-Ion Cell . https://www.youtube.com/watch?si=6ksqM2v-ksH7vB_z&v=ceUSPNzxwls
Combustible dust poses a significant explosion risk across industries such as food processing, chemicals, mining,…
Adhesive hotmelt’s viscosity is a critical property, as it directly impacts its ability to be…
Atomization is a process used to break up a liquid into fine droplets, usually done…
The ability to monitor and control slurry viscosity is key to investment casting. Process instrumentation…