Overview
A paper was published for presentation at the SPE (Society of Petroleum Engineers) Improved Oil Recovery Conference originally scheduled to be held in Tulsa, OK, USA, 18 – 22 April 2020. Due to COVID-19 the physical event was postponed until 31 August – 4 September 2020 and was changed to a virtual event. The paper is titled “Measurement of Transport Properties and Densities of Dimethyl Ether DME and Water/Brine Mixtures” and authored by Jingyu Cui and Yunying Qi, Shell Global Solutions US Inc; Birol Dindoruk, Shell International Exploration and Production Inc.
In this paper, the authors present new data on the systematic density and viscosity measurements for DME and Water for the first time. There is no systematic viscosity data found for DME-brine systems, especially for the condition of interest (reservoir conditions), so they have deployed the Rheonics DVM to get the density and viscosity data under harsh, aggressive conditions and use the data to establish & validate density and viscosity equations for Brine -DME mixtures. Such essential transport data is necessary to be able to evaluate the DME/DEW injection potential for various applications, from EOR/IOR to near wellbore stimulation.
SPE Improved Oil Recovery Conference
Measurement of Transport Properties and Densities of Dimethyl Ether DME and Water/Brine Mixtures
Jingyu Cui and Yunying Qi, Shell Global Solutions US Inc; Birol Dindoruk, Shell International Exploration and Production Inc
Publisher: Society of Petroleum Engineers (SPE)
Paper presented at the SPE Improved Oil Recovery Conference, August 31–September 4, 2020
Paper Number: SPE-200314-MS
DOI: https://doi.org/10.2118/200314-MS
Abstract
Dimethyl ether (DME) is considered to be a potential Enhanced Oil Recovery EOR agent for enhanced waterflooding. Due to its first contact miscibility in hydrocarbons and partial high solubility in water/brine, it partitions preferentially into the hydrocarbon phase upon contact when DME-brine solution is injected into the reservoir. As a result, the residual oil swells and its viscosity is reduced which in turn leads to significantly higher ultimate oil recovery. The amount of swelling and viscosity-reduction depends on the extent of DME partitioning and its availability along with the systems pressure and temperature. In the DME-oil mixing zone, and DME-water zone, the estimation of the DME-Hydrocarbon and DME-water viscosities is crucial to evaluate and understand the performance of DME-enhanced waterflooding (DEW) at reservoir or lab/pilot-scale. Among those, there is no systematic viscosity data found for DME-brine systems, especially for the condition of interest (reservoir conditions). Viscosity of DME-Hydrocarbon follows the traditional mixing rules and expectations quite well; while viscosity of DME-water shown to exhibits very different behavior than expected. In this paper, we present new data on the systematic density and viscosity measurements for DME and Water for the first time. Such essential transport data is necessary to be able to evaluate the DME/DEW injection potential for various applications, from EOR/IOR to near wellbore stimulation.
Some of the important features of this study are:
- New data for the literature to be used for DME and DME enhanced waterflooding
- Correlation development for the measured
Paper Highlights
Introduction
Transport properties especially that of viscosity are crucial in oil production both in terms of operation and economics. Given that DME is a polar component, it was not readily obvious the transport properties of DME-water/brine system will follow the expected trends and mixing rules (i.e., behavior of alkane gases with aqueous solutions).
Based on the symptomatic analysis performed, it was believed that DME-brine solution must have higher viscosity than pure brine solution unless there are other factors. Preliminary viscosity measurements confirmed this hypothesis (Figure 3). Therefore, a deeper look into this unexpected viscosity elevation with respect to water is needed. However, there is no known numerical tool which was able to predict and represent this behavior correctly.
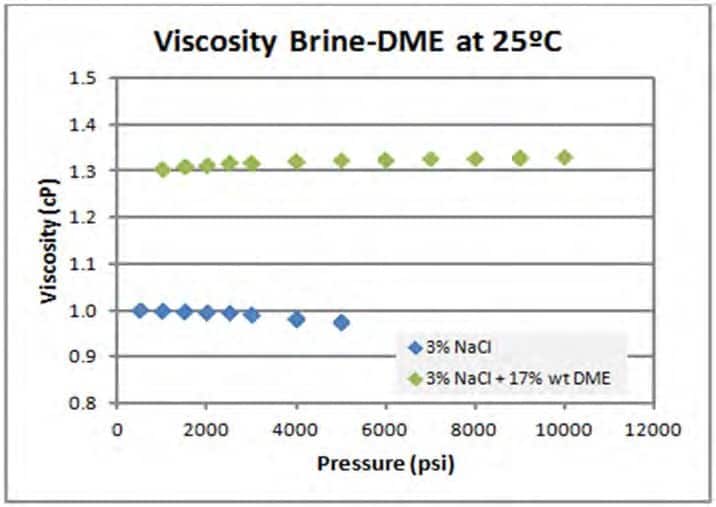
Figure 3—Preliminary Viscosity Measurements for quick-look at the viscosity of DME-brine system at 20 C (Raw data: no pressure and temperature corrections performed, as seen in water-pressure trend).
To be able to explain our observations in the lab and fill this gap in the context of essential data to explain and design laboratory experiments, and enable more reliable forecasts in various scales, we have designed a comprehensive experimental program to address this, and to develop a trend capturing formula or mixing-rule which can be used in populating fluid description requirements for reservoir simulators or other tools to predict DME-brine viscosity and also density. In order to achieve this, we have followed the steps below.
- Measure viscosity and density for DME-DI water solution, covering from pure water to DME solubility limit at various temperatures and pressures;
- Develop a viscosity mixing rule to predict the mixture properties using pure DME and water (brine) properties;
Equipment and Calibration
Density and viscosity of DME-DI water (Brine) mixture were measured using Rheonics DVM. This equipment shows clear advantage in measuring the viscosity for aqueous system comparing to Electro- Magnetic Viscometer (EMV), as it can yield simultaneous measurement of density and viscosity. In addition, Rheonics DVM can perform inline measurements of both density and viscosity at process pressures up to 30,000 psi (2000 bar) and temperature ranges from −20°C to 200°C with a response time of about 1 second per reading.
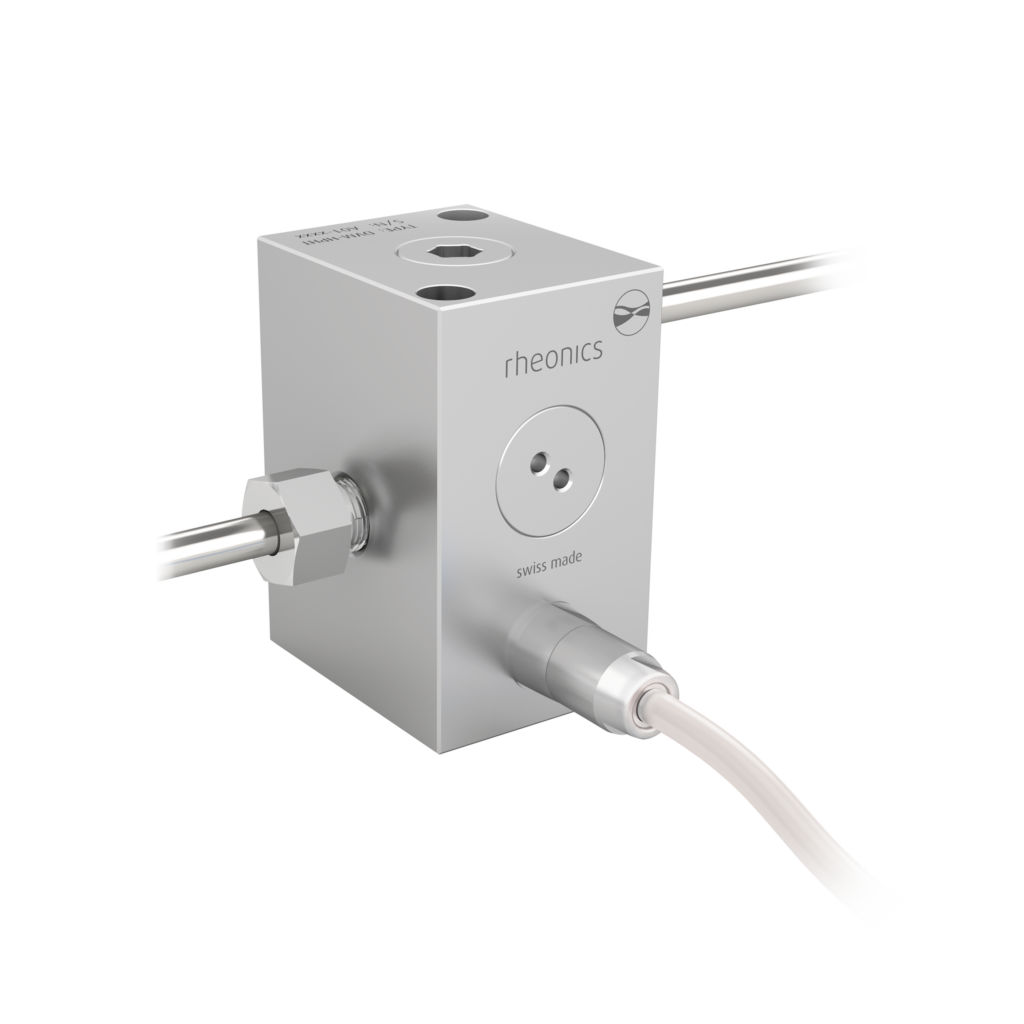
DVM is an inline module to measure the viscosity, density and temperature of the fluid flowing through the module. The flow through module is based on the DVM’s density and viscosity sensor. The module has a flow-through channel with an internal diameter of 12 mm. The Sensor is mounted parallel to the flow path of the fluid and removes any dead zones in the fluid flow. The standard module has Swagelok connections which can be replaced with other suitable threaded connections. A Teflon seal reduces any chance of fluid influx in the connector thread. The sensor DVM is mounted with a threaded bolt to allow easy removal for cleaning and replacement. It has a simple, compact, and robust construction (See Figure 4).
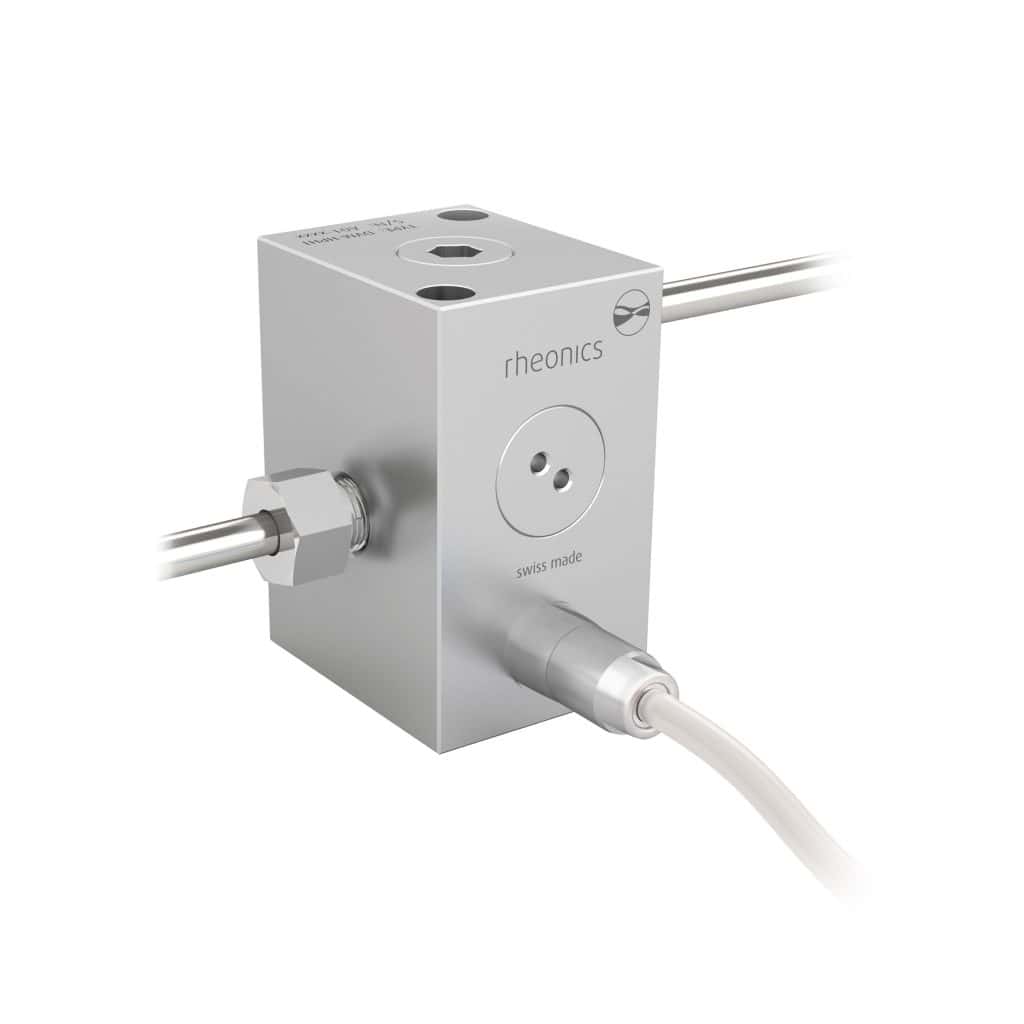
Figure 4—Rheonics in-line DVM Model
The Rheonics DVM measures viscosity and density by means of a torsional resonator, one end of which is immersed in the fluid under test. The more viscous the fluid, the higher the mechanical damping of the resonator. By measuring the damping, the product of viscosity and density may be calculated by Rheonics’ proprietary algorithms. Our initial work showed that the algorithm vendor provided did not taking in to account the effect of pressure and temperature on the equipment. Vendor applied this input to improve their algorithms, and lead to more consistent correction factor. The denser the fluid, the lower the resonant frequency. A denser fluid increases the mass loading of the resonator. The resonator is both excited and sensed by means of an electromagnetic transducer mounted in the sensor’s body.
Damping is measured by sensing and evaluation electronics and stable, high accuracy and repeatable readings are obtained based on proprietary [6] gated phase-locked loop technology.
In order to convert the raw measurements to physically more accurate measurements, device correction parameters were needed for the particular model utilized. Those correction factors were provided by the manufacturer both for viscosity and density.
Data collected with the DVM for this study
Viscosity and Density of DI water at 35°C
Calibration runs were performed before the full measurements performed on DME-Water solutions. It is important to calibrate the system with a known fluid to judge the accuracy of the measurement. As a result, DI water is chosen for this purpose due to two reasons:
- Viscosity of DI water are available at a wide range of pressures and temperatures which contains our P-T domain of interest;
- The interest of this study is largely on aqueous solutions which makes the water an ideal candidate to calibrate the
Calibration experiments were conducted at 35C; results were compared with NIST data at the same temperature. Figure 5 and Figure 6 show good agreement between measured viscosity and density data and that of NIST data.
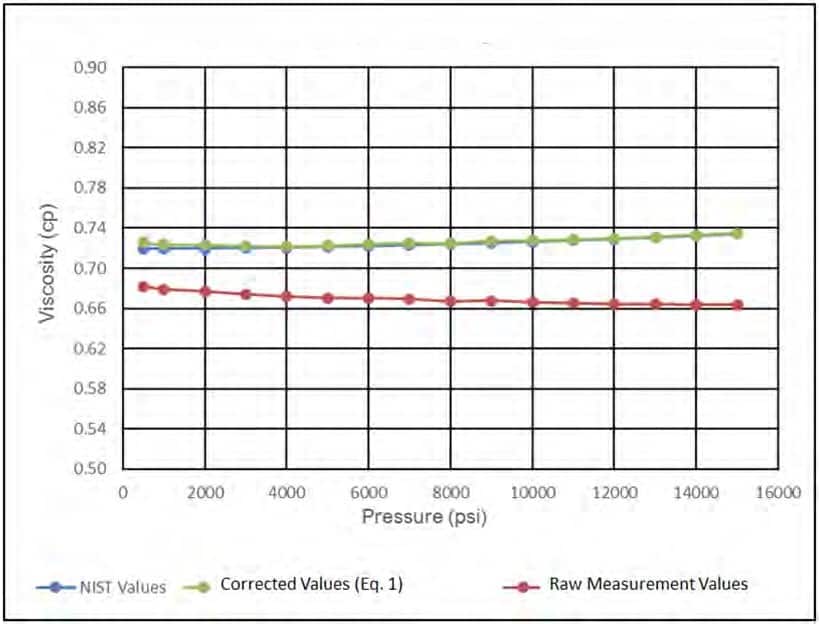
Figure 5—Viscosity of DI Water at 35 C.
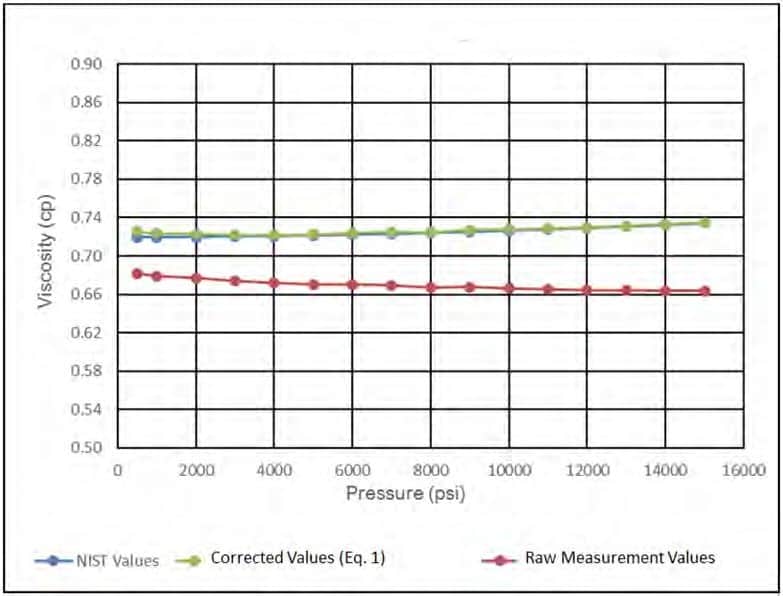
Figure 6—Density of DI water at 35 C.
Density of DME/DI water Mixtures
Based on the experimental matrix in Table 2, density for a series of DME-DI water mixtures have been measured. Tables 3 to 5 present the experimental data at three different temperatures in a tabular form.
Table 3—Density of DI Water/DME Solutions at 35°C.
| Pressure | Concentration | ||||
| psia | 0% DME | 2% DME | 5% DME | 10% DME | 14% DME |
| 400 | 0.9967 | 0.9835 | 0.9656 | 0.9442 | 0.9188 |
| 725 | 0.9976 | 0.9844 | 0.9665 | 0.9452 | 0.9198 |
| 1450 | 0.9997 | 0.9863 | 0.9684 | 0.9472 | 0.9220 |
| 2175 | 1.0017 | 0.9882 | 0.9702 | 0.9492 | 0.9243 |
| 3000 | 1.0038 | 0.9903 | 0.9723 | 0.9514 | 0.9268 |
| 4000 | 1.0065 | 0.9930 | 0.9749 | 0.9540 | 0.9297 |
| 5000 | 1.0092 | 0.9955 | 0.9781 | 0.9567 | 0.9326 |
| 6000 | 1.0119 | 0.9981 | 0.9800 | 0.9592 | 0.9354 |
| 7000 | 1.0145 | 1.0007 | 0.9825 | 0.9618 | 0.9382 |
| 8000 | 1.0171 | 1.0032 | 0.9850 | 0.9644 | 0.9410 |
| 9000 | 1.0197 | 1.0058 | 0.9874 | 0.9669 | 0.9437 |
| 10000 | 1.0224 | 1.0083 | 0.9900 | 0.9695 | 0.9464 |
| 11000 | 1.0249 | 1.0108 | 0.9924 | 0.9720 | 0.9491 |
Table 4—Density of DI Water/DME Solutions at 50°C.
| Pressure | Concentration | ||||
| psia | 0% DME | 2% DME | 5% DME | 10% DME | 14% DME |
| 400 | 0.9905 | 0.9769 | 0.9575 | 0.9348 | 0.9099 |
| 725 | 0.9914 | 0.9777 | 0.9581 | 0.9358 | 0.9108 |
| 1450 | 0.9933 | 0.9796 | 0.9603 | 0.9380 | 0.9134 |
| 2175 | 0.9953 | 0.9815 | 0.9622 | 0.9401 | 0.9159 |
| 3000 | 0.9975 | 0.9837 | 0.9644 | 0.9425 | 0.9186 |
| 4000 | 1.0001 | 0.9862 | 0.9669 | 0.9454 | 0.9218 |
| 5000 | 1.0027 | 0.9888 | 0.9695 | 0.9482 | 0.9249 |
| 6000 | 1.0054 | 0.9914 | 0.9721 | 0.9509 | 0.9281 |
| 7000 | 1.0079 | 0.9940 | 0.9747 | 0.9536 | 0.9310 |
| 8000 | 1.0105 | 0.9965 | 0.9772 | 0.9564 | 0.9339 |
| 9000 | 1.0131 | 0.9990 | 0.9797 | 0.9591 | 0.9368 |
| 10000 | 1.0157 | 1.0016 | 0.9823 | 0.9617 | 0.9397 |
| 11000 | 1.0182 | 1.0040 | 0.9848 | 0.9644 | 0.9425 |
Table 5—Density of DI Water/DME Solutions at 70°C.
| Pressure | Concentration | ||||
| psia | 0% DME | 2% DME | 5% DME | 10% DME | 14% DME |
| 400 | 0.9800 | 0.9656 | 0.9443 | 0.9217 | 0.8936 |
| 725 | 0.9809 | 0.9665 | 0.9452 | 0.9228 | 0.8965 |
| 1450 | 0.9828 | 0.9686 | 0.9474 | 0.9251 | 0.9003 |
| 2175 | 0.9848 | 0.9705 | 0.9494 | 0.9274 | 0.9031 |
| 3000 | 0.9870 | 0.9724 | 0.9517 | 0.9300 | 0.9060 |
| 4000 | 0.9896 | 0.9751 | 0.9545 | 0.9330 | 0.9094 |
| 5000 | 0.9923 | 0.9777 | 0.9572 | 0.9360 | 0.9125 |
| 6000 | 0.9950 | 0.9804 | 0.9599 | 0.9390 | 0.9156 |
| 7000 | 0.9975 | 0.9830 | 0.9626 | 0.9419 | 0.9187 |
| 8000 | 1.0001 | 0.9856 | 0.9652 | 0.9448 | 0.9217 |
| 9000 | 1.0027 | 0.9881 | 0.9679 | 0.9476 | 0.9247 |
| 10000 | 1.0053 | 0.9907 | 0.9705 | 0.9503 | 0.9276 |
| 11000 | 1.0078 | 0.9932 | 0.9731 | 0.9531 | 0.9305 |
Figure 8 shows a selected isotherm for the density of DI water/DME solution. As expected, density increases as pressure increases and decreases as DME concentration increases. Figure 9 shows the density behavior of a DI water/DME solution (5 mol% DME) at different temperatures, density decreases as temperature increases.
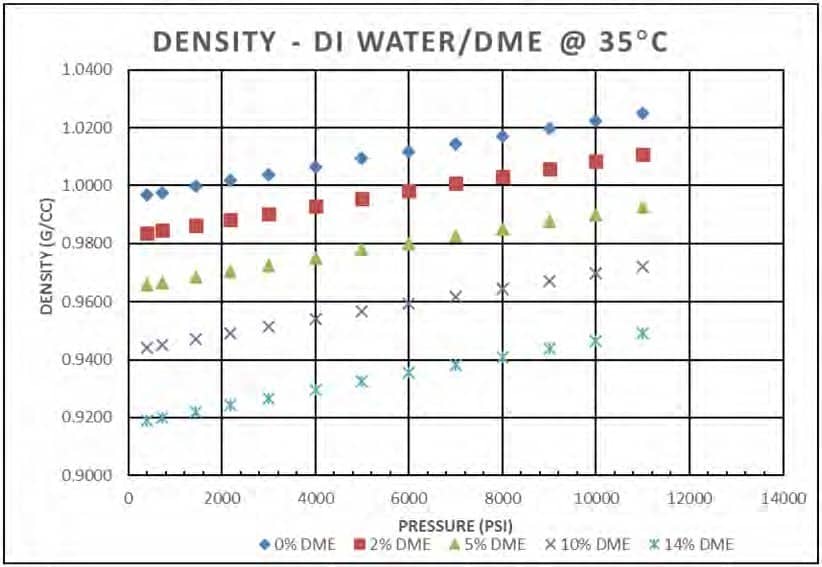
Figure 8—Density of DI water/DME solutions at 35°C.
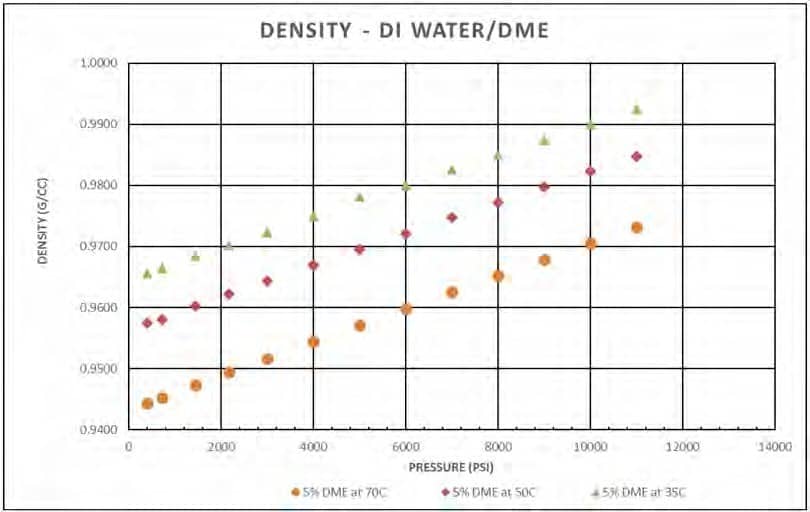
Figure 9—Density of DI water/5 mol % DME solution at different temperatures.
Viscosity of DME/DI water Mixture
Similarly, viscosities of DME/DI water were also measured at corresponding concentrations and conditions. Tables 6 and 8 present the measured data in tabular form.
Table 6—Viscosities of DI Water/DME Solutions at 35°C.
| Pressure | Concentration | ||||
| psia | 0% DME | 2% DME | 5% DME | 10% DME | 14% DME |
| 400 | 0.7350 | 0.8342 | 0.9346 | 1.0062 | 1.0010 |
| 725 | 0.7377 | 0.8344 | 0.9405 | 1.0132 | 1.0066 |
| 1450 | 0.7388 | 0.8361 | 0.9432 | 1.0231 | 1.0123 |
| 2175 | 0.7380 | 0.8387 | 0.9439 | 1.0301 | 1.0189 |
| 3000 | 0.7372 | 0.8412 | 0.9577 | 1.0384 | 1.0247 |
| 4000 | 0.7358 | 0.8439 | 0.9575 | 1.0488 | 1.0390 |
| 5000 | 0.7346 | 0.8457 | 0.9613 | 1.0570 | 1.0508 |
| 6000 | 0.7339 | 0.8498 | 0.9538 | 1.0612 | 1.0637 |
| 7000 | 0.7336 | 0.8520 | 0.9557 | 1.0658 | 1.0739 |
| 8000 | 0.7308 | 0.8535 | 0.9637 | 1.0663 | 1.0811 |
| 9000 | 0.7297 | 0.8551 | 0.9652 | 1.0772 | 1.0927 |
| 10000 | 0.7284 | 0.8527 | 0.9669 | 1.0857 | 1.1002 |
| 11000 | 0.7310 | 0.8519 | 0.9670 | 1.0943 | 1.1124 |
Table 7—Viscosities of DI Water/DME Solutions at 50°C.
| Pressure | Concentration | ||||
| psia | 0% DME | 2% DME | 5% DME | 10% DME | 14% DME |
| 400 | 0.5433 | 0.6181 | 0.6943 | 0.7121 | 0.7157 |
| 725 | 0.5441 | 0.6199 | 0.6948 | 0.7160 | 0.7073 |
| 1450 | 0.5471 | 0.6208 | 0.6973 | 0.7234 | 0.7111 |
| 2175 | 0.5481 | 0.6236 | 0.6969 | 0.7305 | 0.7237 |
| 3000 | 0.5499 | 0.6259 | 0.7005 | 0.7384 | 0.7329 |
| 4000 | 0.5520 | 0.6280 | 0.7071 | 0.7456 | 0.7444 |
| 5000 | 0.5552 | 0.6235 | 0.7045 | 0.7569 | 0.7531 |
| 6000 | 0.5557 | 0.6276 | 0.7074 | 0.7660 | 0.7602 |
| 7000 | 0.5579 | 0.6298 | 0.7092 | 0.7749 | 0.7715 |
| 8000 | 0.5607 | 0.6317 | 0.7128 | 0.7859 | 0.7756 |
| 9000 | 0.5612 | 0.6362 | 0.7175 | 0.7923 | 0.7852 |
| 10000 | 0.5630 | 0.6383 | 0.7198 | 0.7918 | |
| 11000 | 0.5635 | 0.6376 | 0.7216 | 0.8038 | 0.8035 |
Table 8—Viscosities of DI Water/DME Solutions at 70°C.
| Pressure | Concentration | ||||
| psia | 0% DME | 2% DME | 5% DME | 10% DME | 14% DME |
| 400 | 0.4003 | 0.4422 | 0.4791 | 0.4783 | 0.5041 |
| 725 | 0.4016 | 0.4402 | 0.4812 | 0.4789 | 0.4962 |
| 1450 | 0.4029 | 0.4420 | 0.4828 | 0.4985 | |
| 2175 | 0.4054 | 0.4437 | 0.4832 | 0.4859 | 0.5011 |
| 3000 | 0.4076 | 0.4451 | 0.4844 | 0.4898 | 0.5090 |
| 4000 | 0.4097 | 0.4468 | 0.4873 | 0.4952 | 0.5191 |
| 5000 | 0.4122 | 0.4494 | 0.4953 | 0.5003 | 0.5270 |
| 6000 | 0.4132 | 0.4522 | 0.4976 | 0.5068 | 0.5366 |
| 7000 | 0.4136 | 0.4517 | 0.5011 | 0.5137 | 0.5420 |
| 8000 | 0.4160 | 0.4540 | 0.5058 | 0.5206 | 0.5495 |
| 9000 | 0.4181 | 0.4551 | 0.5088 | 0.5259 | 0.5520 |
| 10000 | 0.4193 | 0.4561 | 0.5105 | 0.5330 | 0.5601 |
| 11000 | 0.4193 | 0.4564 | 0.5123 | 0.5351 | 0.5666 |
Figure 10 shows that viscosity of DI water/DME solutions slightly increases as pressure increases, and it also increases with increasing DME concentration which is contrary to expectations. Figure 11 shows the viscosity of DI water/DME solution with 5 mol% DME at different temperatures; as expected, the viscosity of such solution decreases as temperature increases.
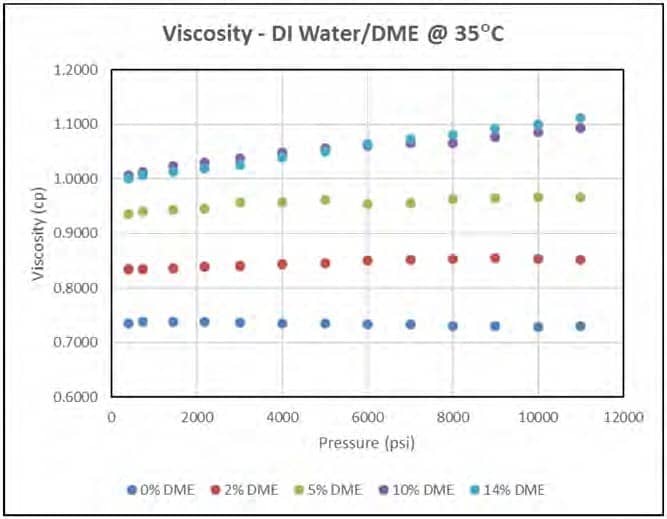
Figure 10—Viscosity of DI water/5 mol % DME solutions at 35°C.
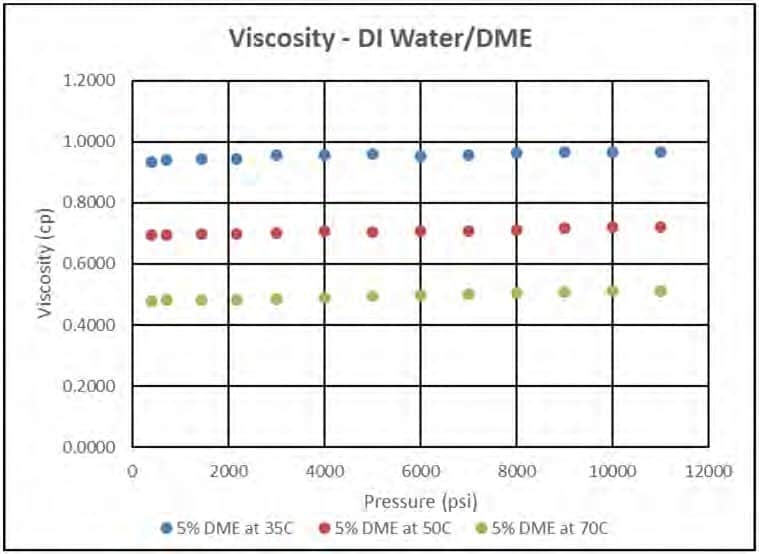
Figure 11—Viscosity of DI water/DME solution at different Temperatures.
In order to be able to predict density and viscosity of a wide range of DI water/DME mixtures, correlations in the form of mixing rules have been developed using the generated set of experimental data and pure component properties.
In the following section, using the experiments performed, we will demonstrate the range of validity and accuracy of the simple correlative tools that we have developed for Brine-DME systems.
Validation of Density Equations for Brine-DME Mixtures
Table 14—Density of 3 wt % brine/DME Solution at 35 C.
| Experimental Density (g/cc) | Calculated Density (g/cc) | Relative Error (%) | |||||||
| psia | 2% DME | 5% DME | 8% DME | 2% DME | 5% DME | 8% DME | 2% DME | 5% DME | 8% DME |
| 400 | 1.0000 | 0.9832 | 0.9696 | 1.0006 | 0.9796 | 0.9612 | −0.06 | 0.37 | 0.87 |
| 725 | 1.0008 | 0.9840 | 0.9703 | 1.0016 | 0.9811 | 0.9630 | −0.08 | 0.30 | 0.75 |
| 1450 | 1.0026 | 0.9859 | 0.9721 | 1.0037 | 0.9840 | 0.9664 | −0.11 | 0.19 | 0.59 |
| 2175 | 1.0045 | 0.9877 | 0.9741 | 1.0057 | 0.9865 | 0.9693 | −0.13 | 0.13 | 0.49 |
| 3000 | 1.0066 | 0.9898 | 0.9762 | 1.0078 | 0.9889 | 0.9720 | −0.12 | 0.09 | 0.43 |
| 4000 | 1.0091 | 0.9924 | 0.9788 | 1.0101 | 0.9916 | 0.9749 | −0.11 | 0.08 | 0.40 |
| 5000 | 1.0116 | 0.9948 | 0.9813 | 1.0124 | 0.9939 | 0.9772 | −0.08 | 0.09 | 0.42 |
| 6000 | 1.0141 | 0.9973 | 0.9839 | 1.0145 | 0.9960 | 0.9793 | −0.04 | 0.13 | 0.47 |
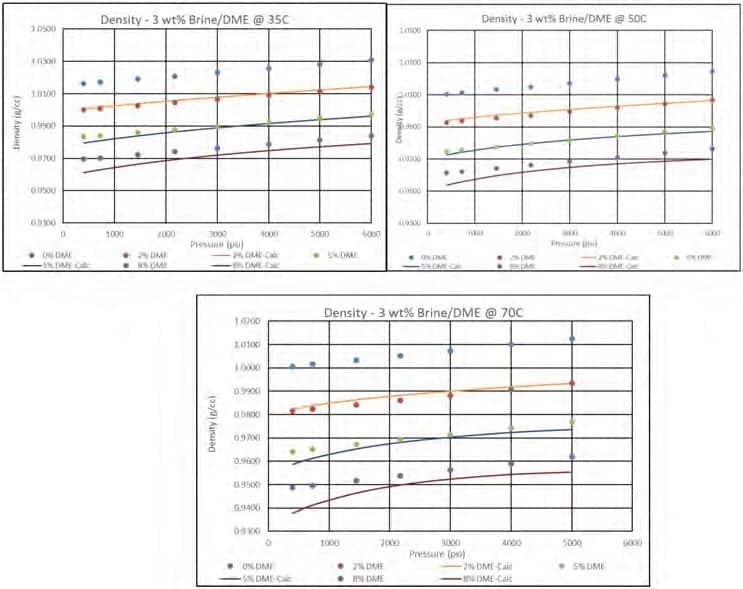
Figure 13—Density of 3wt% Brine/DME at different Temperatures.
Overall the proposed mixing rule for density predicts the mixture density well at medium to low DME concentrations, and slightly underpredicts at higher DME concentrations (i.e., 8 mol %) while the deviations are still within the expected margins.
Validation of Density Equations for Brine-DME Mixtures
Table 15—Viscosity of 3 wt % NaCl brine/DME solution at 35 C.
| Pressure | Experimental Viscosity (cp) | Calculated Viscosity (cp) | Relative Error | |||||||
| psia | 0% DME | 2% DME | 5% DME | 8% DME | 2% DME | 5% DME | 8% DME | 2% DME | 5% DME | 8% DME |
| 400 | 0.7537 | 0.8462 | 0.9535 | 1.0220 | 0.9209 | 0.9824 | 1.0392 | −8.82 | −3.03 | −1.68 |
| 725 | 0.7650 | 0.8485 | 0.9563 | 1.0159 | 0.9217 | 0.9838 | 1.0413 | −8.63 | −2.87 | −2.51 |
| 1450 | 0.7616 | 0.8332 | 0.9532 | 1.0201 | 0.9238 | 0.9869 | 1.0462 | −10.87 | −3.53 | −2.55 |
| 2175 | 0.7641 | 0.8334 | 0.9516 | 1.0313 | 0.9257 | 0.9899 | 1.0507 | −11.08 | −4.02 | −1.88 |
| 3000 | 0.7594 | 0.8388 | 0.9527 | 1.0235 | 0.9279 | 0.9931 | 1.0557 | −10.62 | −4.25 | −3.15 |
| 4000 | 0.7553 | 0.8400 | 0.9410 | 1.0221 | 0.9304 | 0.9968 | 1.0613 | −10.76 | −5.93 | −3.83 |
| 5000 | 0.7528 | 0.8439 | 0.9520 | 1.0330 | 0.9329 | 1.0006 | 1.0670 | −10.54 | −5.10 | −3.29 |
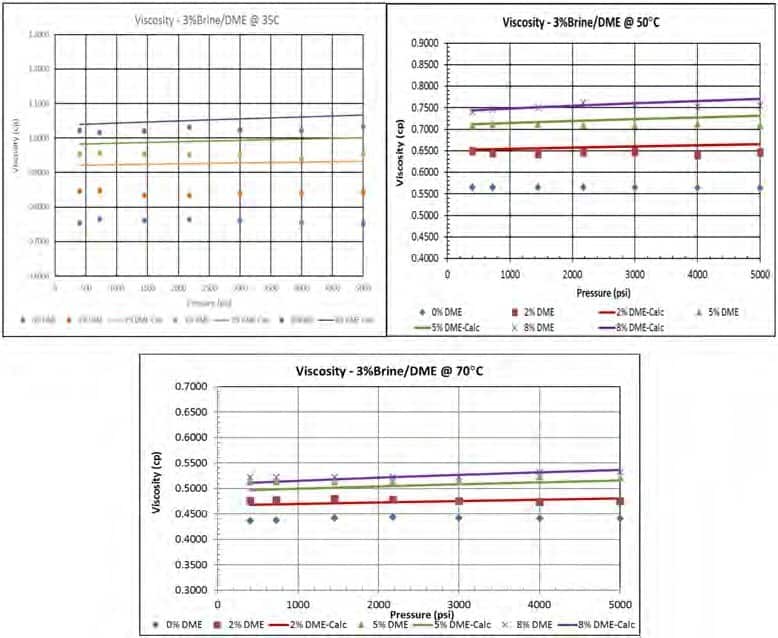
Figure 14—Viscosity of 3 wt % NaCl Brine/DME at different temperatures.
Figure 14 indicates that the mixing rules for the viscosity over estimates the viscosities at 35 C, at 50 C and 70 C, while still showing an overall good agreement with the experimental data.
Conclusion/Results from the study
A systematic methodology with a newer viscometer (Rheonics DVM) was developed for DME dissolved aqueous systems. After initial calibrations and verification tests with known substances, such as water,
- Density and viscosity of DI water/DME, Brine/DME systems have been measured extensively at 35 C, 50 C, and 70 C and various pressures and DME
- To our knowledge, the subject sets of viscosity and density measurements are the first in the literature. They can be used for evaluation and/or de-risking DME enhanced water floods (DEW) and other uses of DME beyond water We provide such data for the literature.
- Mixing rule type of to calculate density and viscosity for these mixtures have been developed and validated; the calculated values agree well with experimental data and constitute a simple set of tools to generate needed density and viscosity values of Brine/DME mixtures within the conditions evaluated for various applications such as simulators.