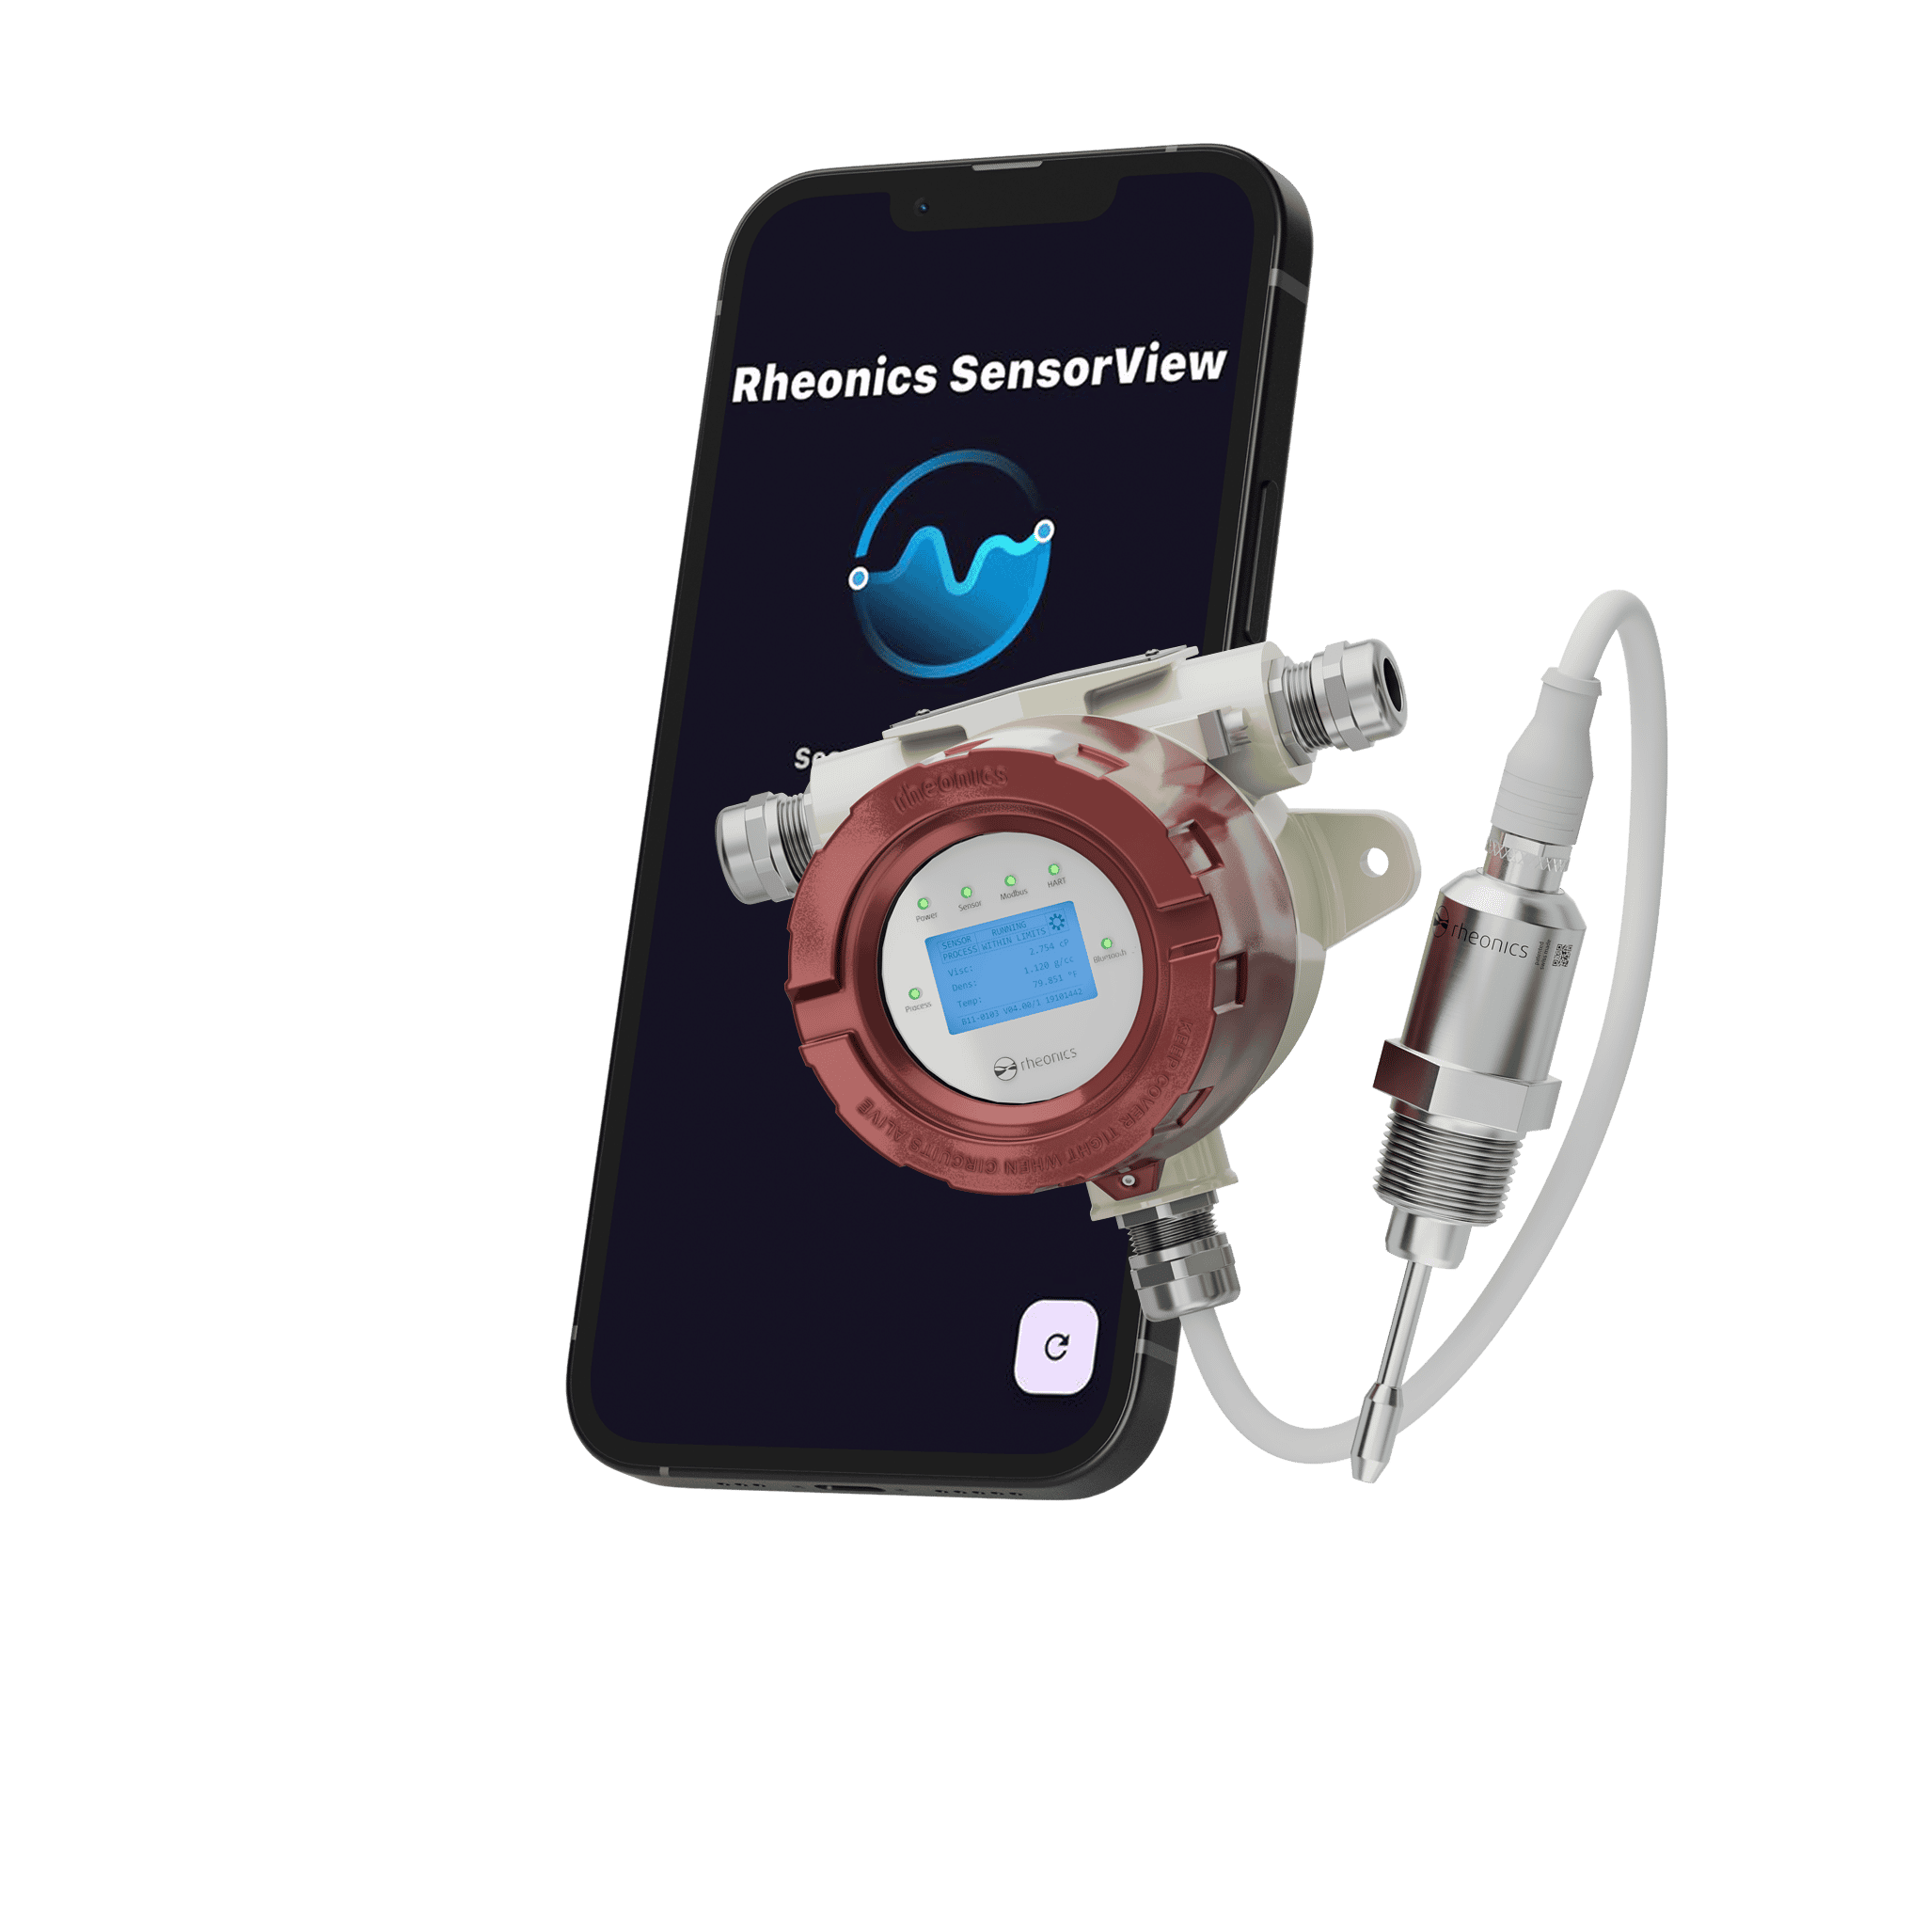
Sensor
View app
Monitor, analyze, and manage your viscosity and density data from any smartphone or tablet. Seamless integration with SRV and SRD sensors for smarter process control.
What the sensor view app brings to your measurements
The Rheonics SensorView App turns complex industrial data into intuitive insights. By leveraging our SME electronics, the app delivers laboratory-grade analytics directly to your mobile device, empowering your team to make faster, data-driven decisions on the go.

Instant Diagnostics
Break free from wired constraints. Access critical fluid data from a safe distance, ideal for hazardous environments or hard-to-reach installations.

Data at Your Fingertips
Visualize dynamic viscosity, density, and temperature in real-time. Export data logs directly from your device for analysis and reporting.

Wireless Monitoring
Eliminate guesswork. Use the "Sensor Health" dashboard to monitor resonance stability and signal quality, ensuring your measurements are always accurate.
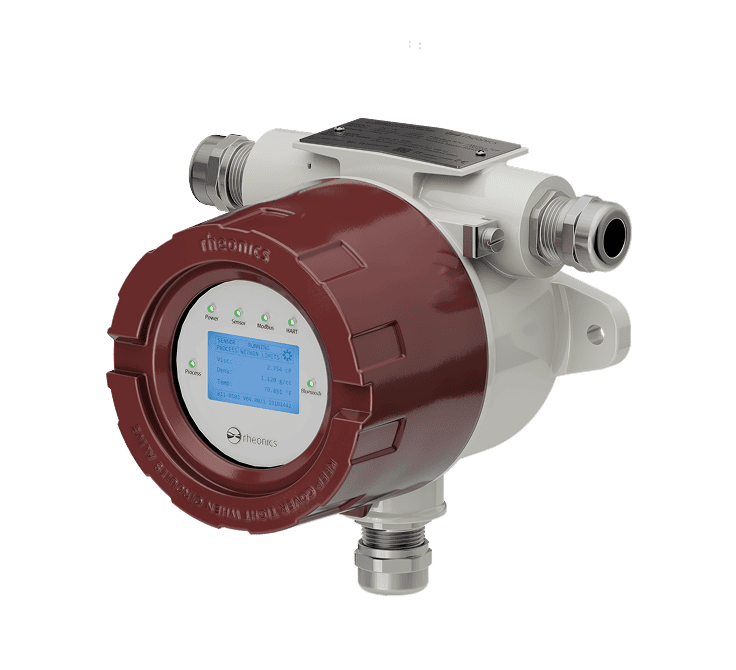
Optimized for SME-TRD Electronics
The Rheonics SensorView App is engineered to transform how you interact with your process data. Currently, the app is optimized for our SME-TRD series, providing a seamless wireless bridge between your sensor and your mobile device.
SME-TRD
This is currently the exclusive electronic variant compatible with the SensorView App. It is specifically designed for real-time field visualization and wireless interaction.
Powerful Insights, Simplified
The SensorView interface is designed for clarity and speed. From high-level process trends to deep-dive sensor diagnostics, get a complete 360-degree view of your fluid properties in seconds
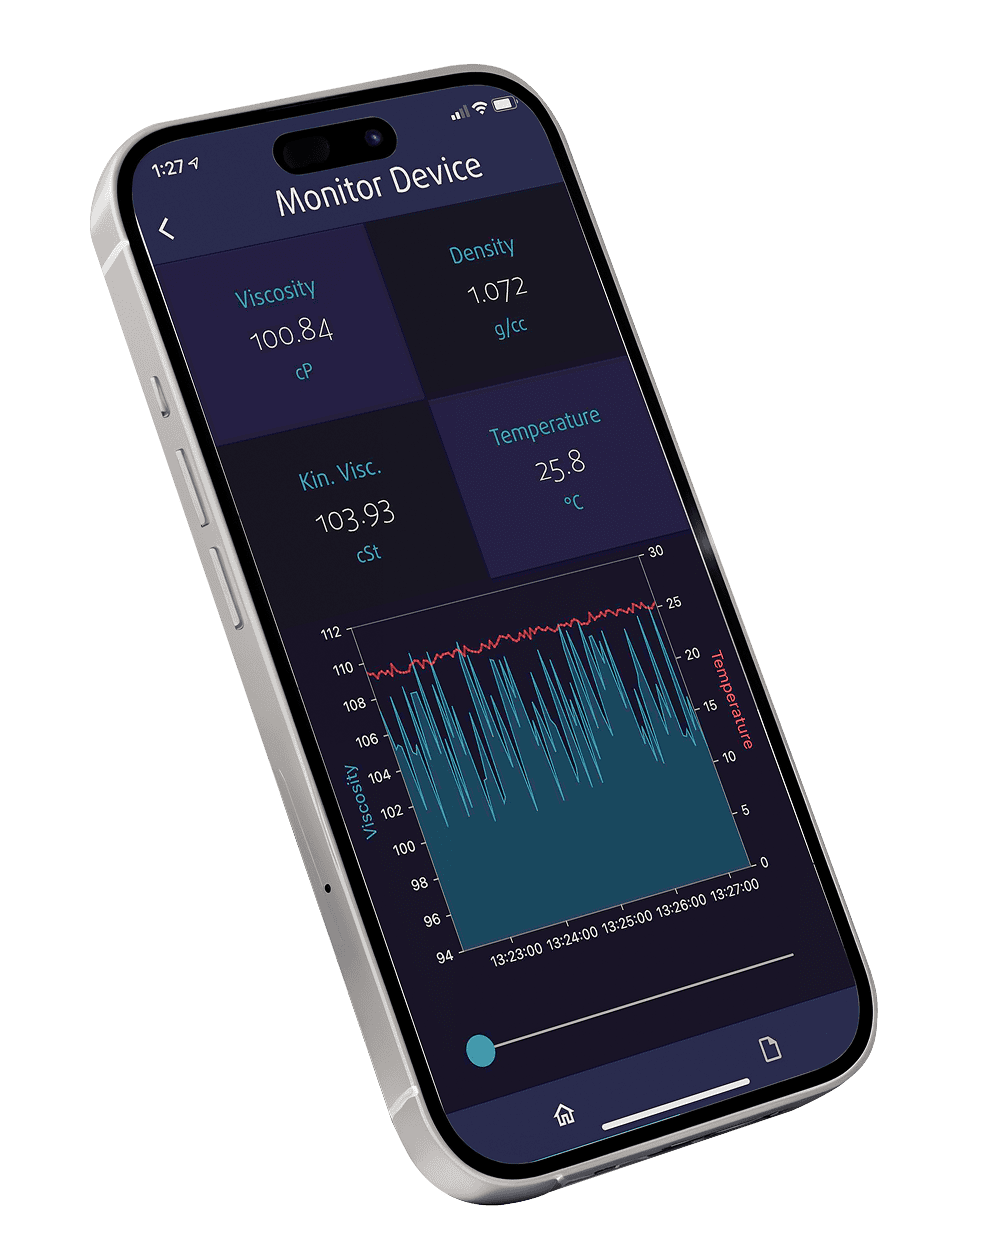
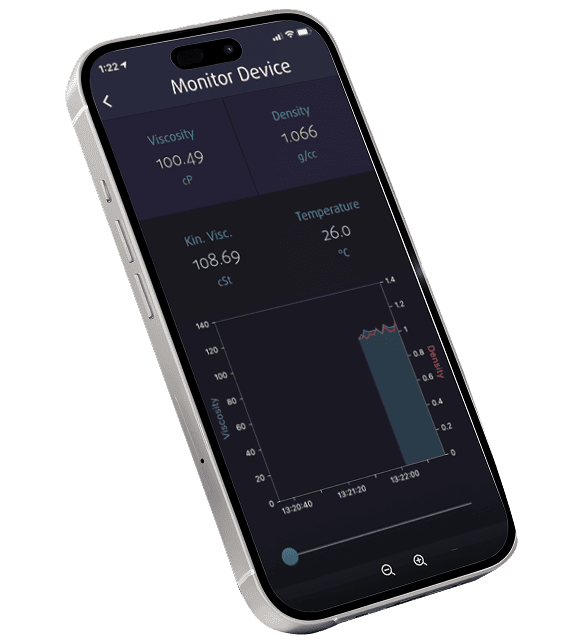
Real-Time
Monitoring
Immediate, high-precision visibility of your fluid’s current state. This dashboard displays the exact live values of Dynamic Viscosity, Density, and Temperature, ensuring your process is running within specifications at this very second.
Process Trends
& Charting
Analyze your process stability over time. The integrated charting tool plots live data against a timeline (from 5 to 60 minutes), allowing operators to detect drifts, cycles, or sudden deviations that a single numerical value won't reveal.
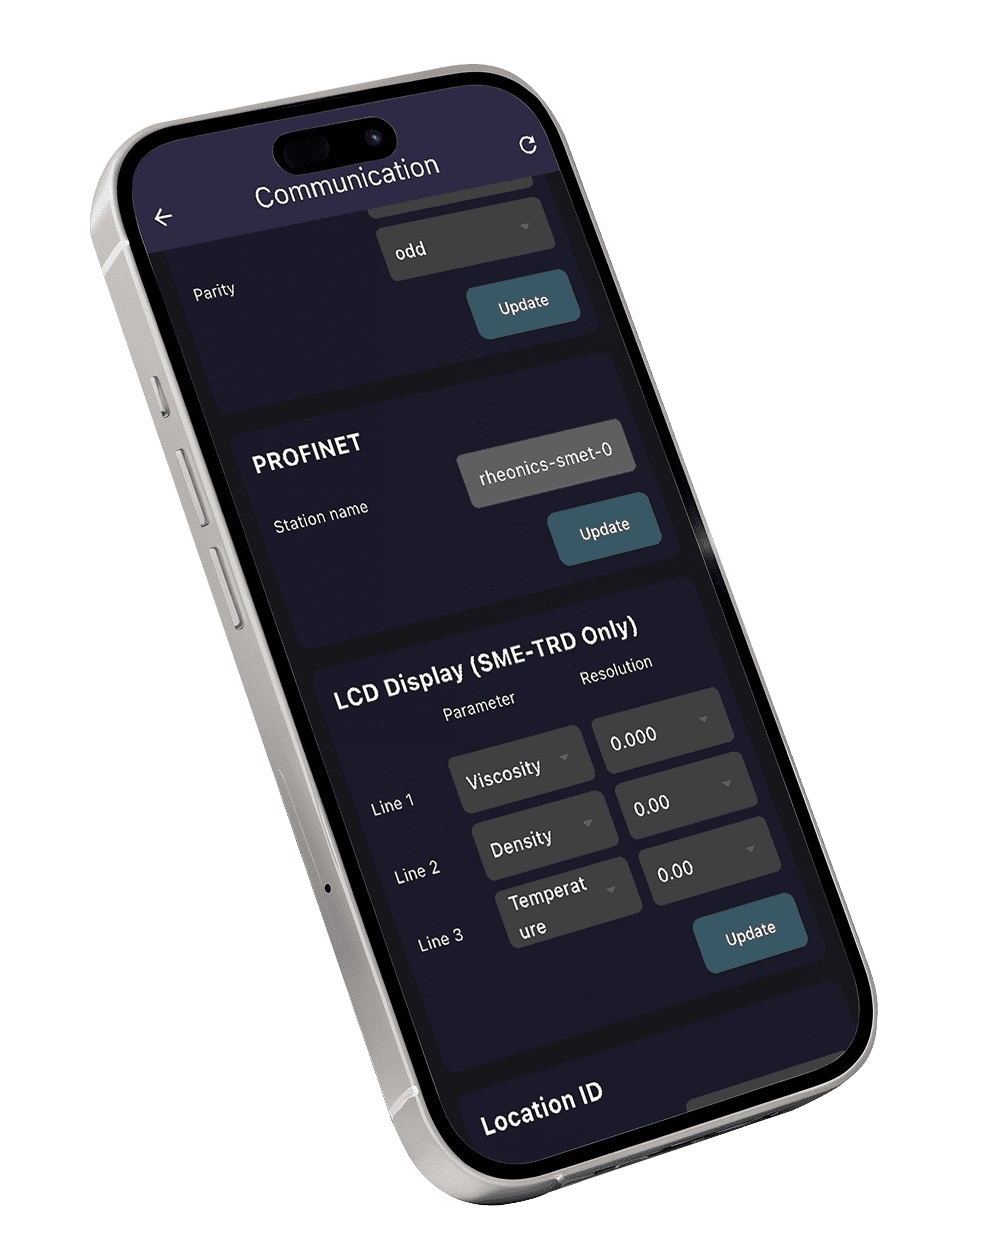
Smart Sensor
Configuration
Seamlessly interact with your SME-TRD electronics. Wirelessly adjust sensor parameters, calibrate scales, and switch measurement units via Bluetooth LE 4.0, eliminating the need for complex wiring or opening the transmitter housing in the field.
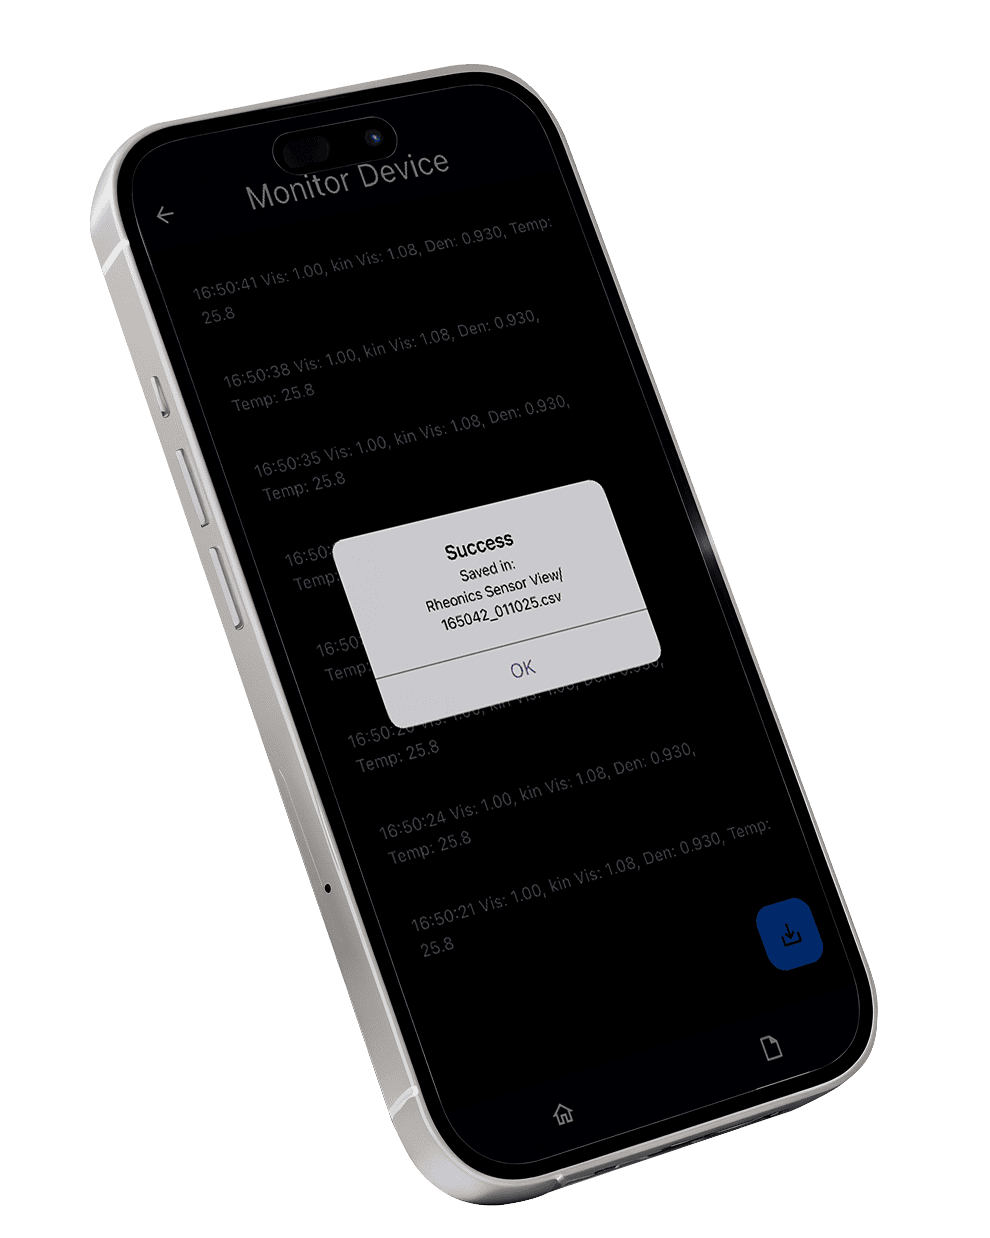
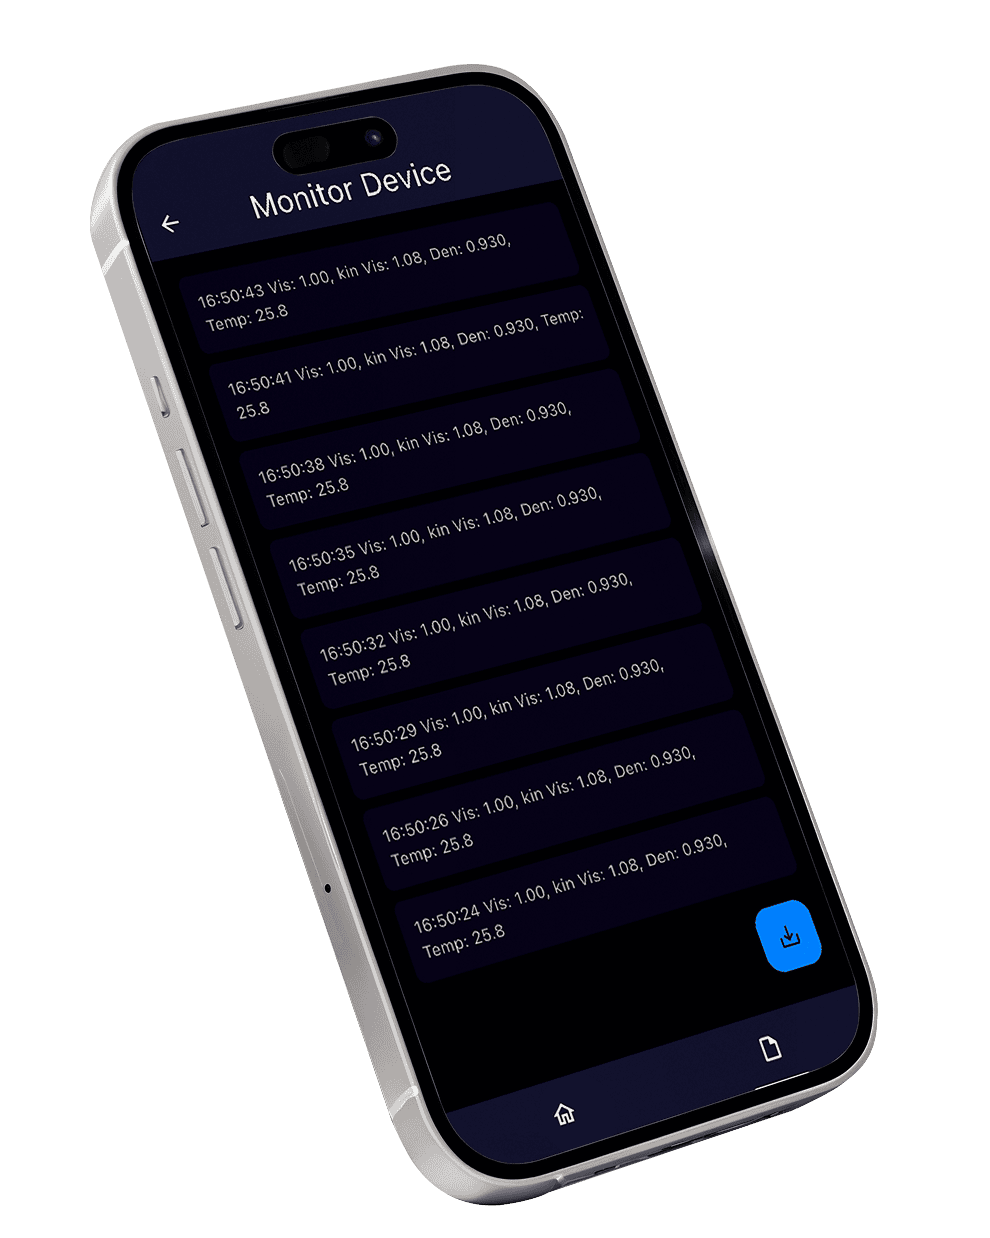
Data Logging
& Export
Turn measurements into actionable insights. Automatically log process data and export it in universal formats directly from your phone. Perfect for quality control documentation, shift reports, and off-site laboratory analysis.
Getting Started
Going from installation to live data is a matter of clicks. No complex wiring or deep programming required—just seamless wireless synchronization.
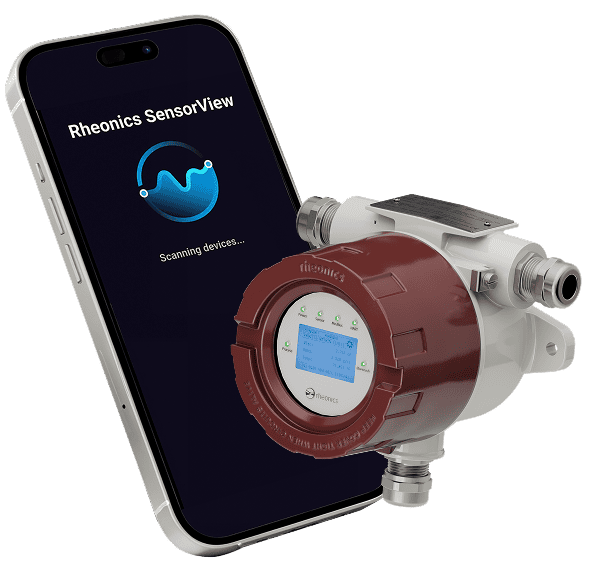
Power & Pair
Ensure your Rheonics SME transmitter is powered on. Open the SensorView App on your device; it will automatically scan for nearby sensors via Bluetooth LE.
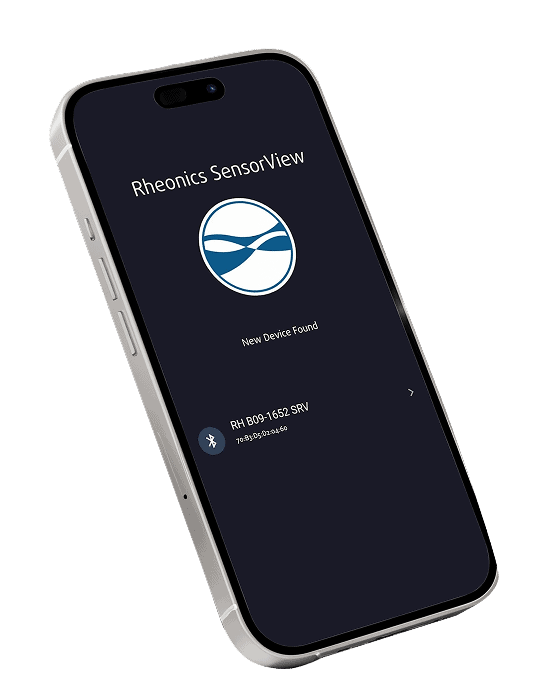
Select Your Device
Identify your sensor from the list of available devices. The App provides secure, one-touch pairing for immediate access.
Start Monitoring
Instantly view live viscosity, density, and temperature readings. Access the "Health" tab to verify the system's operational integrity.
Previous Versions
Details
The Rheonics SensorView App is the mobile interface optimized for operators and technicians who require instantaneous access to sensor data directly from the measurement point. Through a secure wireless connection, the app transforms any smartphone or tablet into a portable control hub for SRV, SRD, DVP, and DVM sensors.
Have a question about the versions?
- Application Release.
- Enabled Real-Time Data view using the SME-TRD bluetooth connection.
- Demo mode available to see how the application works.
- Interchangeable plot view between Kinematic Viscosity, Dynamic Viscosity, Density and Temperature.
- Save and export measured data for further analysis.
- Configure and adjust sensor parameters
- Change language: English, French, German, Japanese, Portuguese, Spanish.
Ready to Optimize Your Process?
Download the Rheonics SensorView App today and take the first step toward smarter, wireless fluid monitoring.