
BatterySlurry Monitoring
Batteries play a central role in modern life powering smartphones, electric vehicles and renewable energy systems.
Problem statement
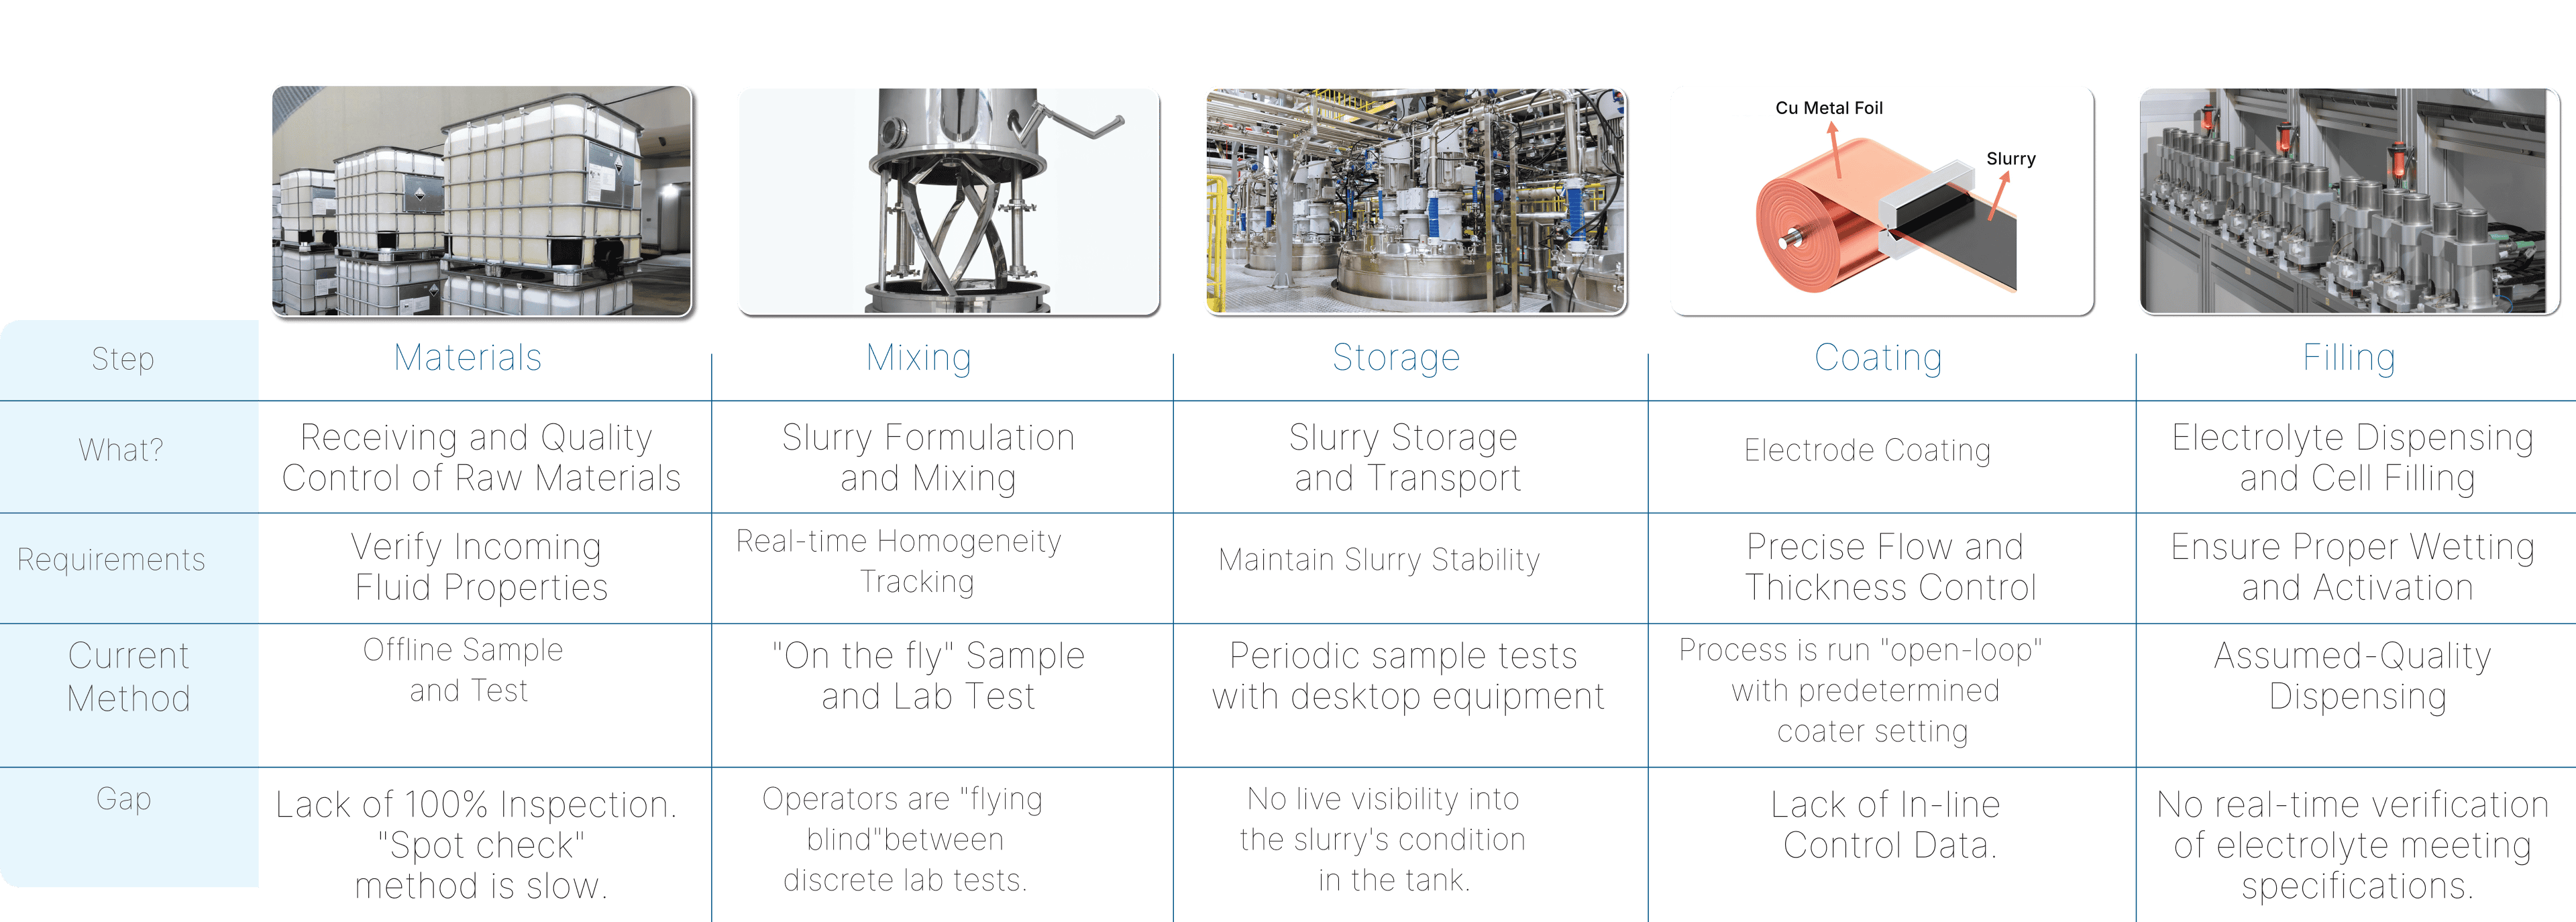
Battery manufacturing
is a rapidly growing industry that demands consistent quality and process control.
Electrode slurry
preparation remains largely research-driven, relying on manual, sampling-based measurements that lack real-time and autonomous data collection for large scale processes like mixing, coating and filling
Quality control
need vary across production stages, from incoming material inspection, requiring full traceability of high-value ingredients from multiple suppliers to process and final product assurance.
Lack of unified system to control battery electrode slurry across the complete ecosystem
Rheonics Solution


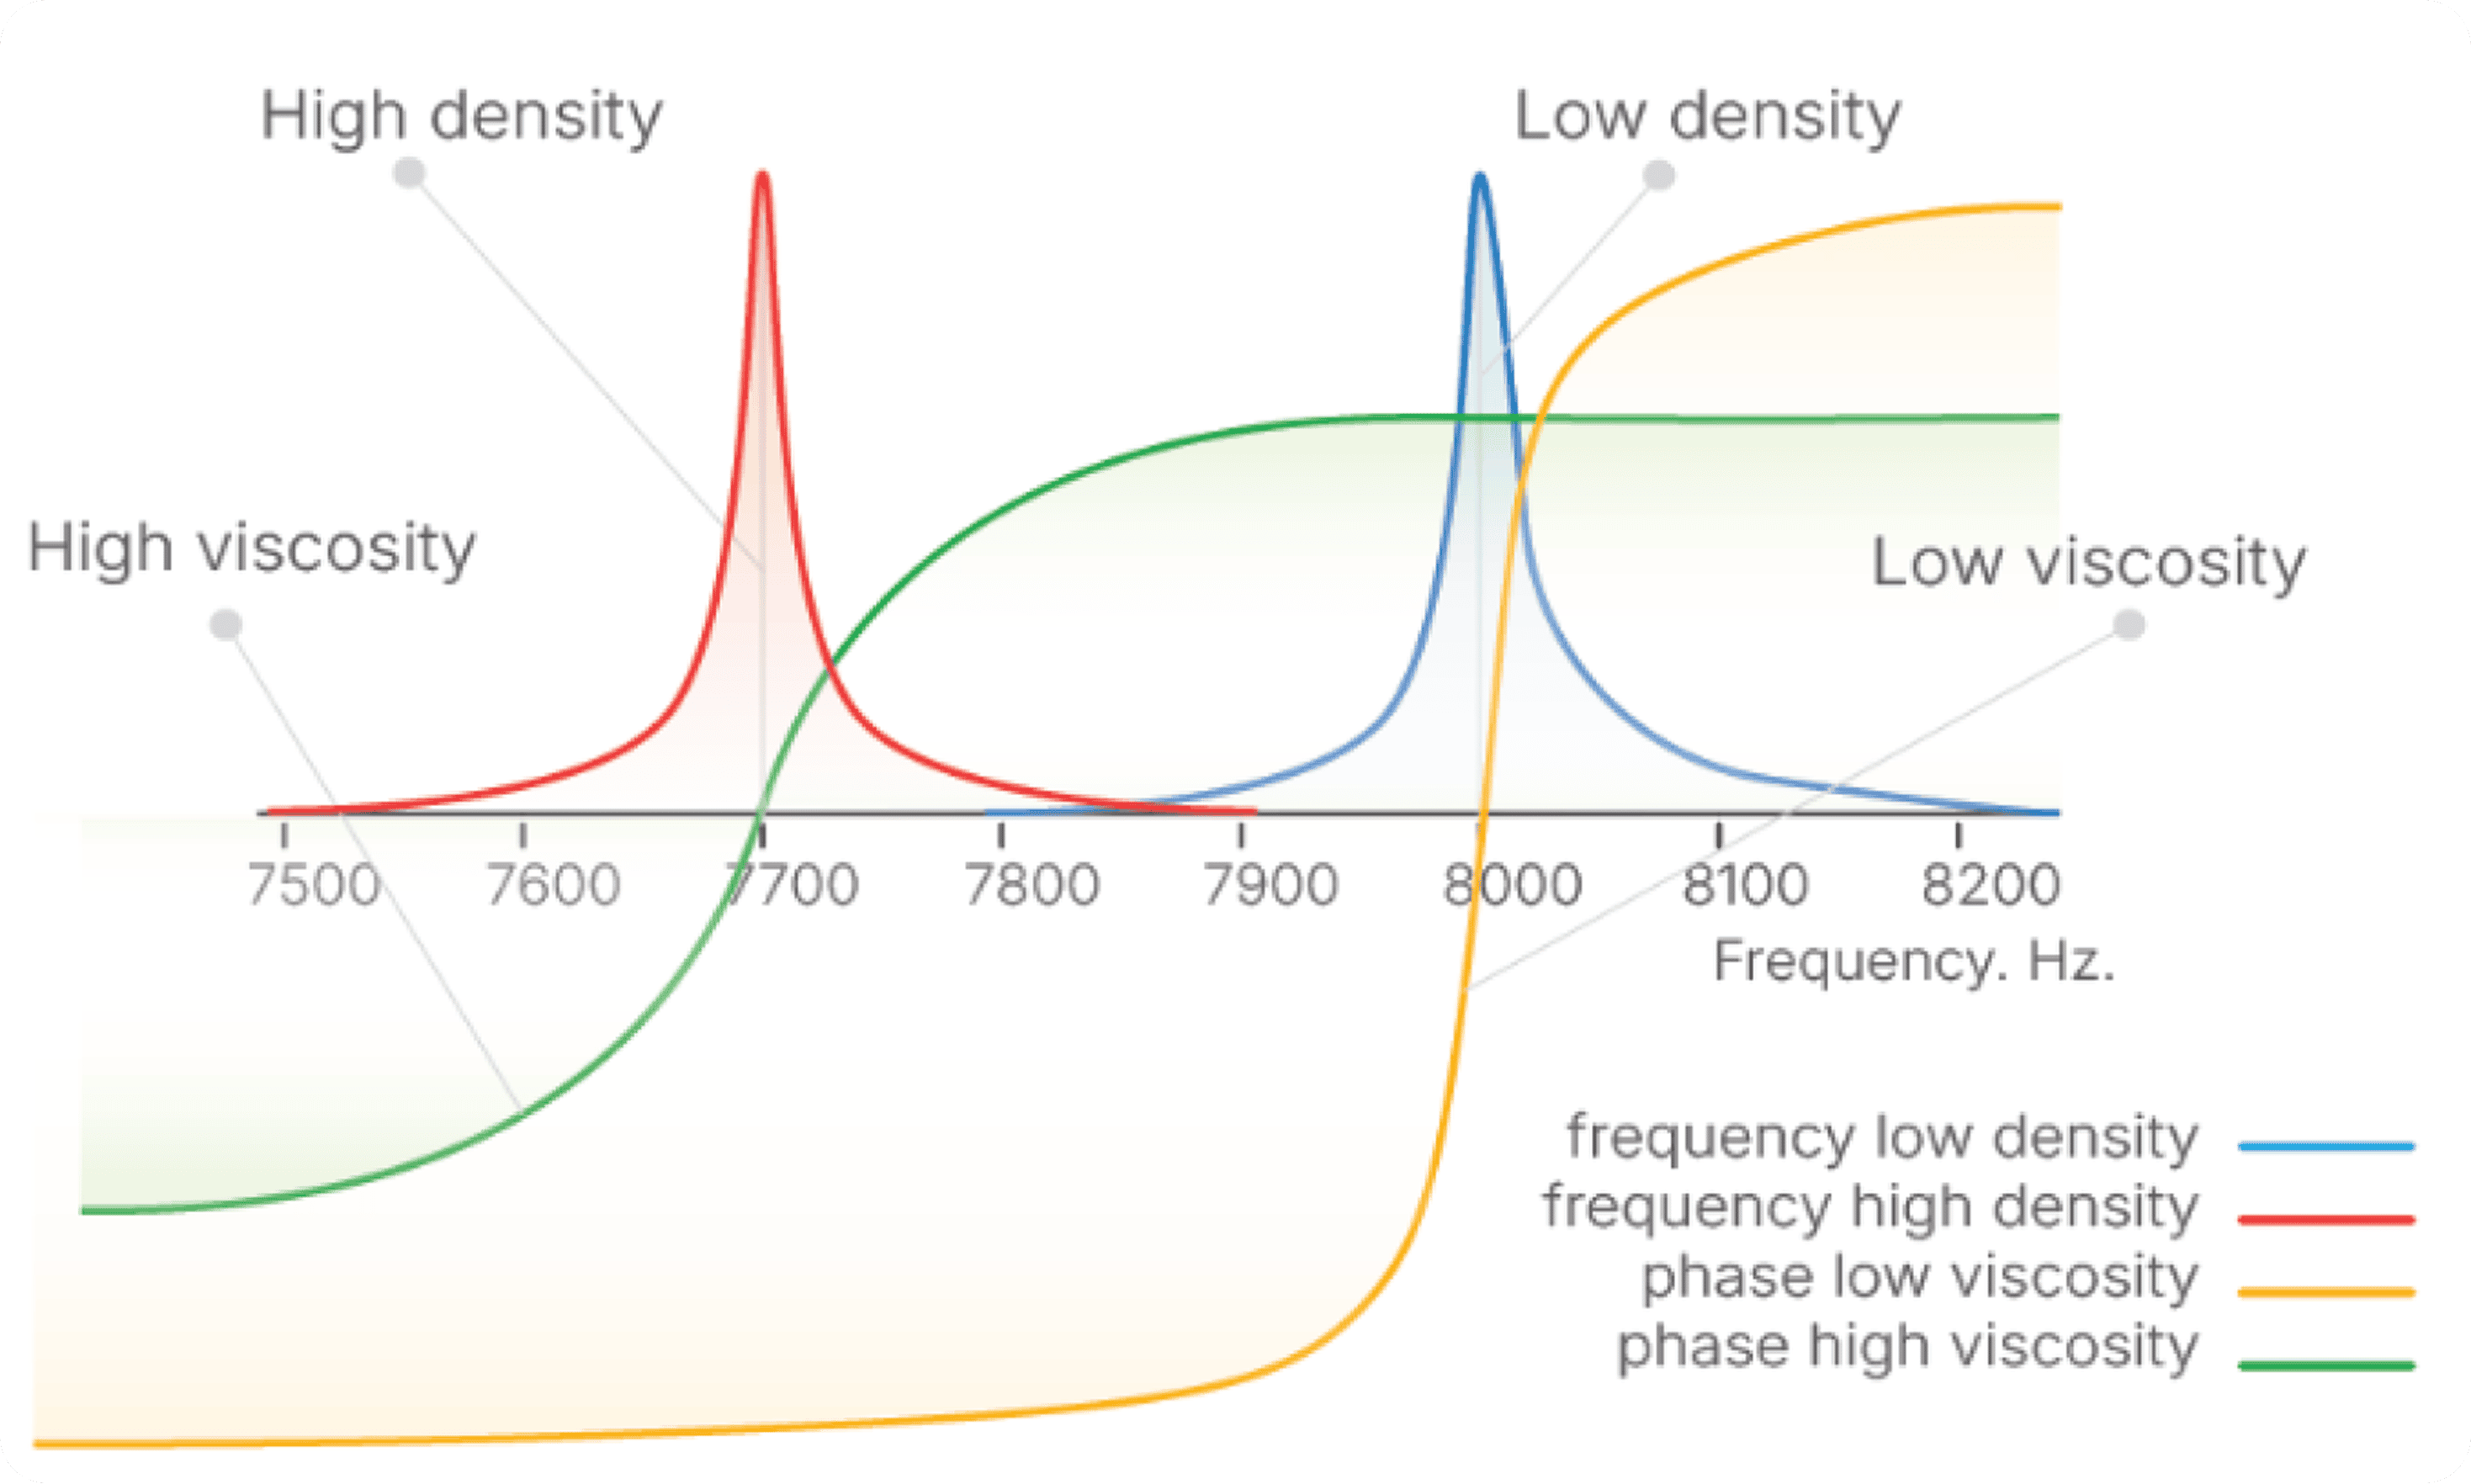
Resonance Response
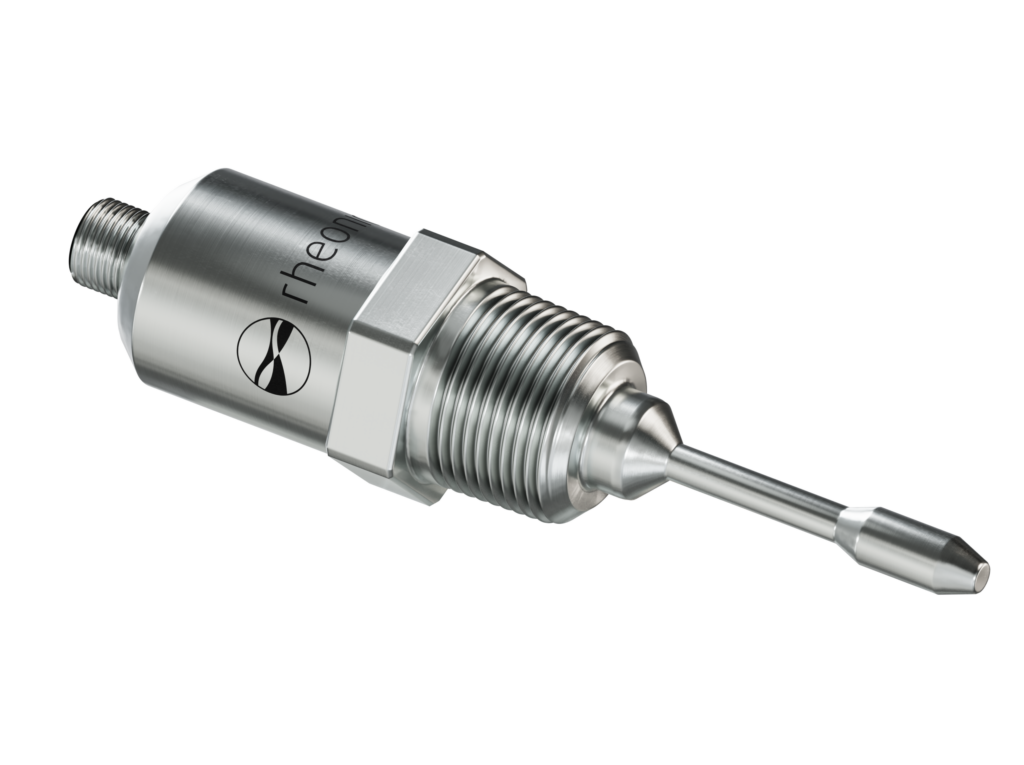
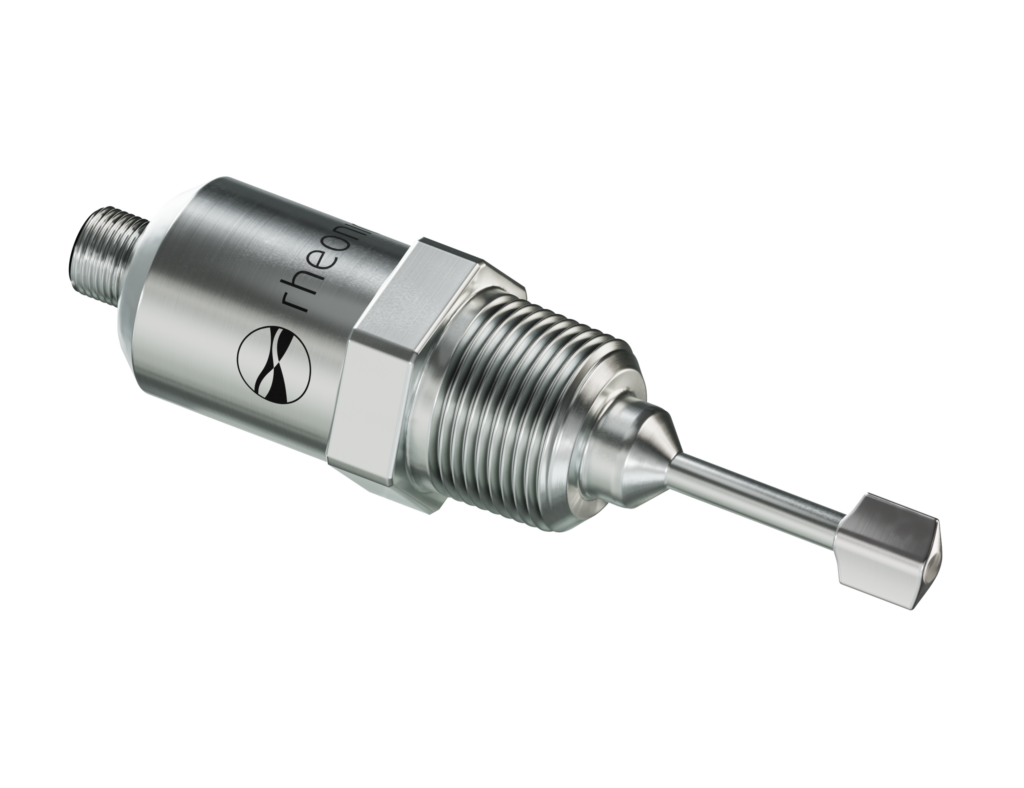
- • Patented BTW (Balance Torsional Resonator) technology
- • Unaffected by external vibrations
- • Plug and play design
- • Different certifications avaible for hazardous zones
- • Robust and hermetically sealed
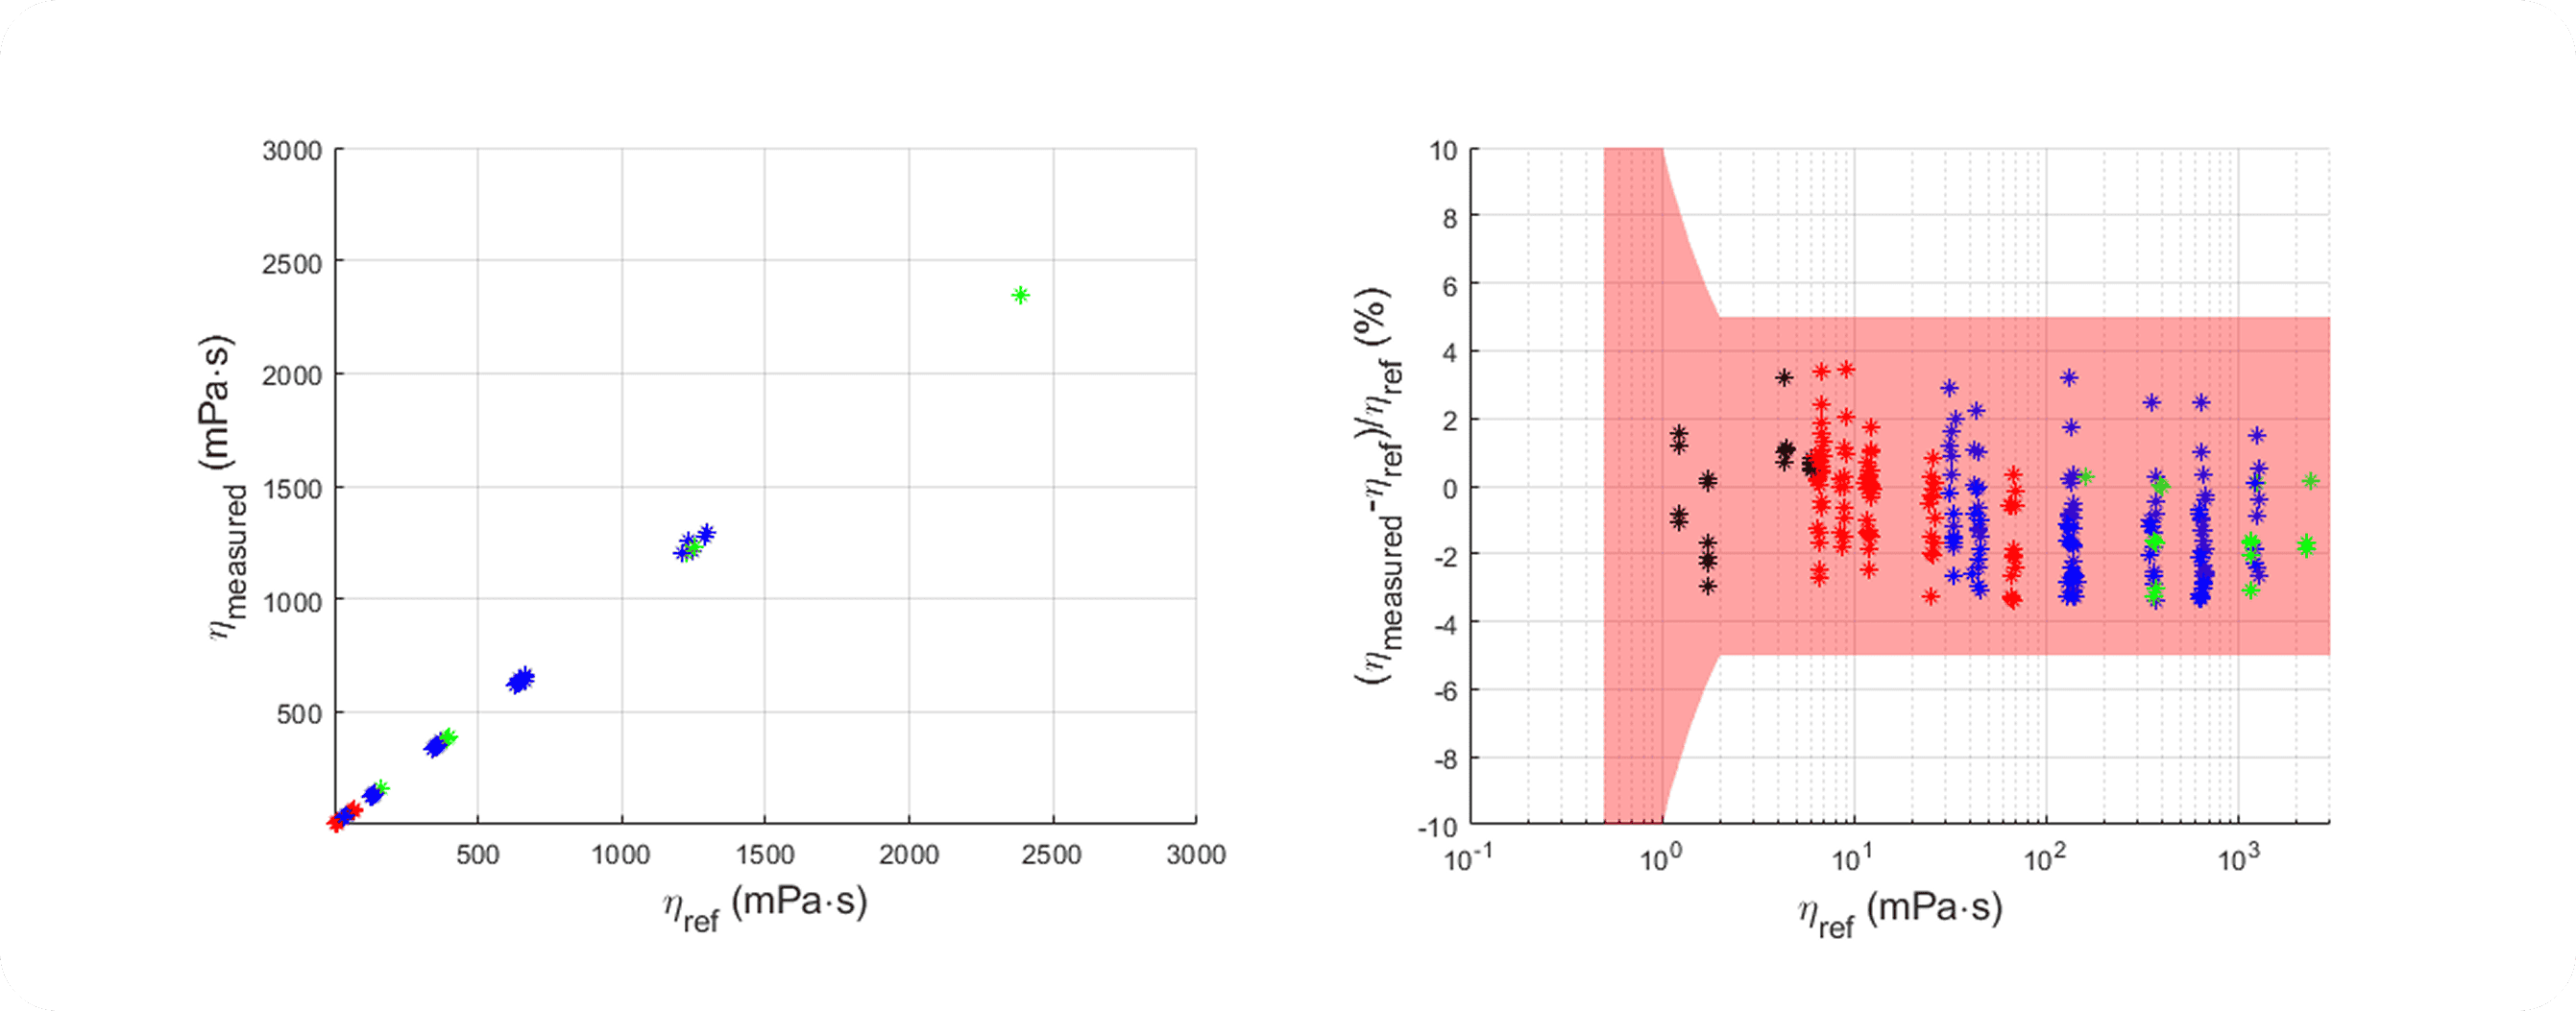
Measurements - SRV
- • Viscosity Range 0.4-250,000+ cP
- • Reproducibility Better than 1% of reading
- • Process Temperature -40 C to 300 C (-40 F to 575 F)
- • Pressure Rating Up to 500 bar (7500psi)
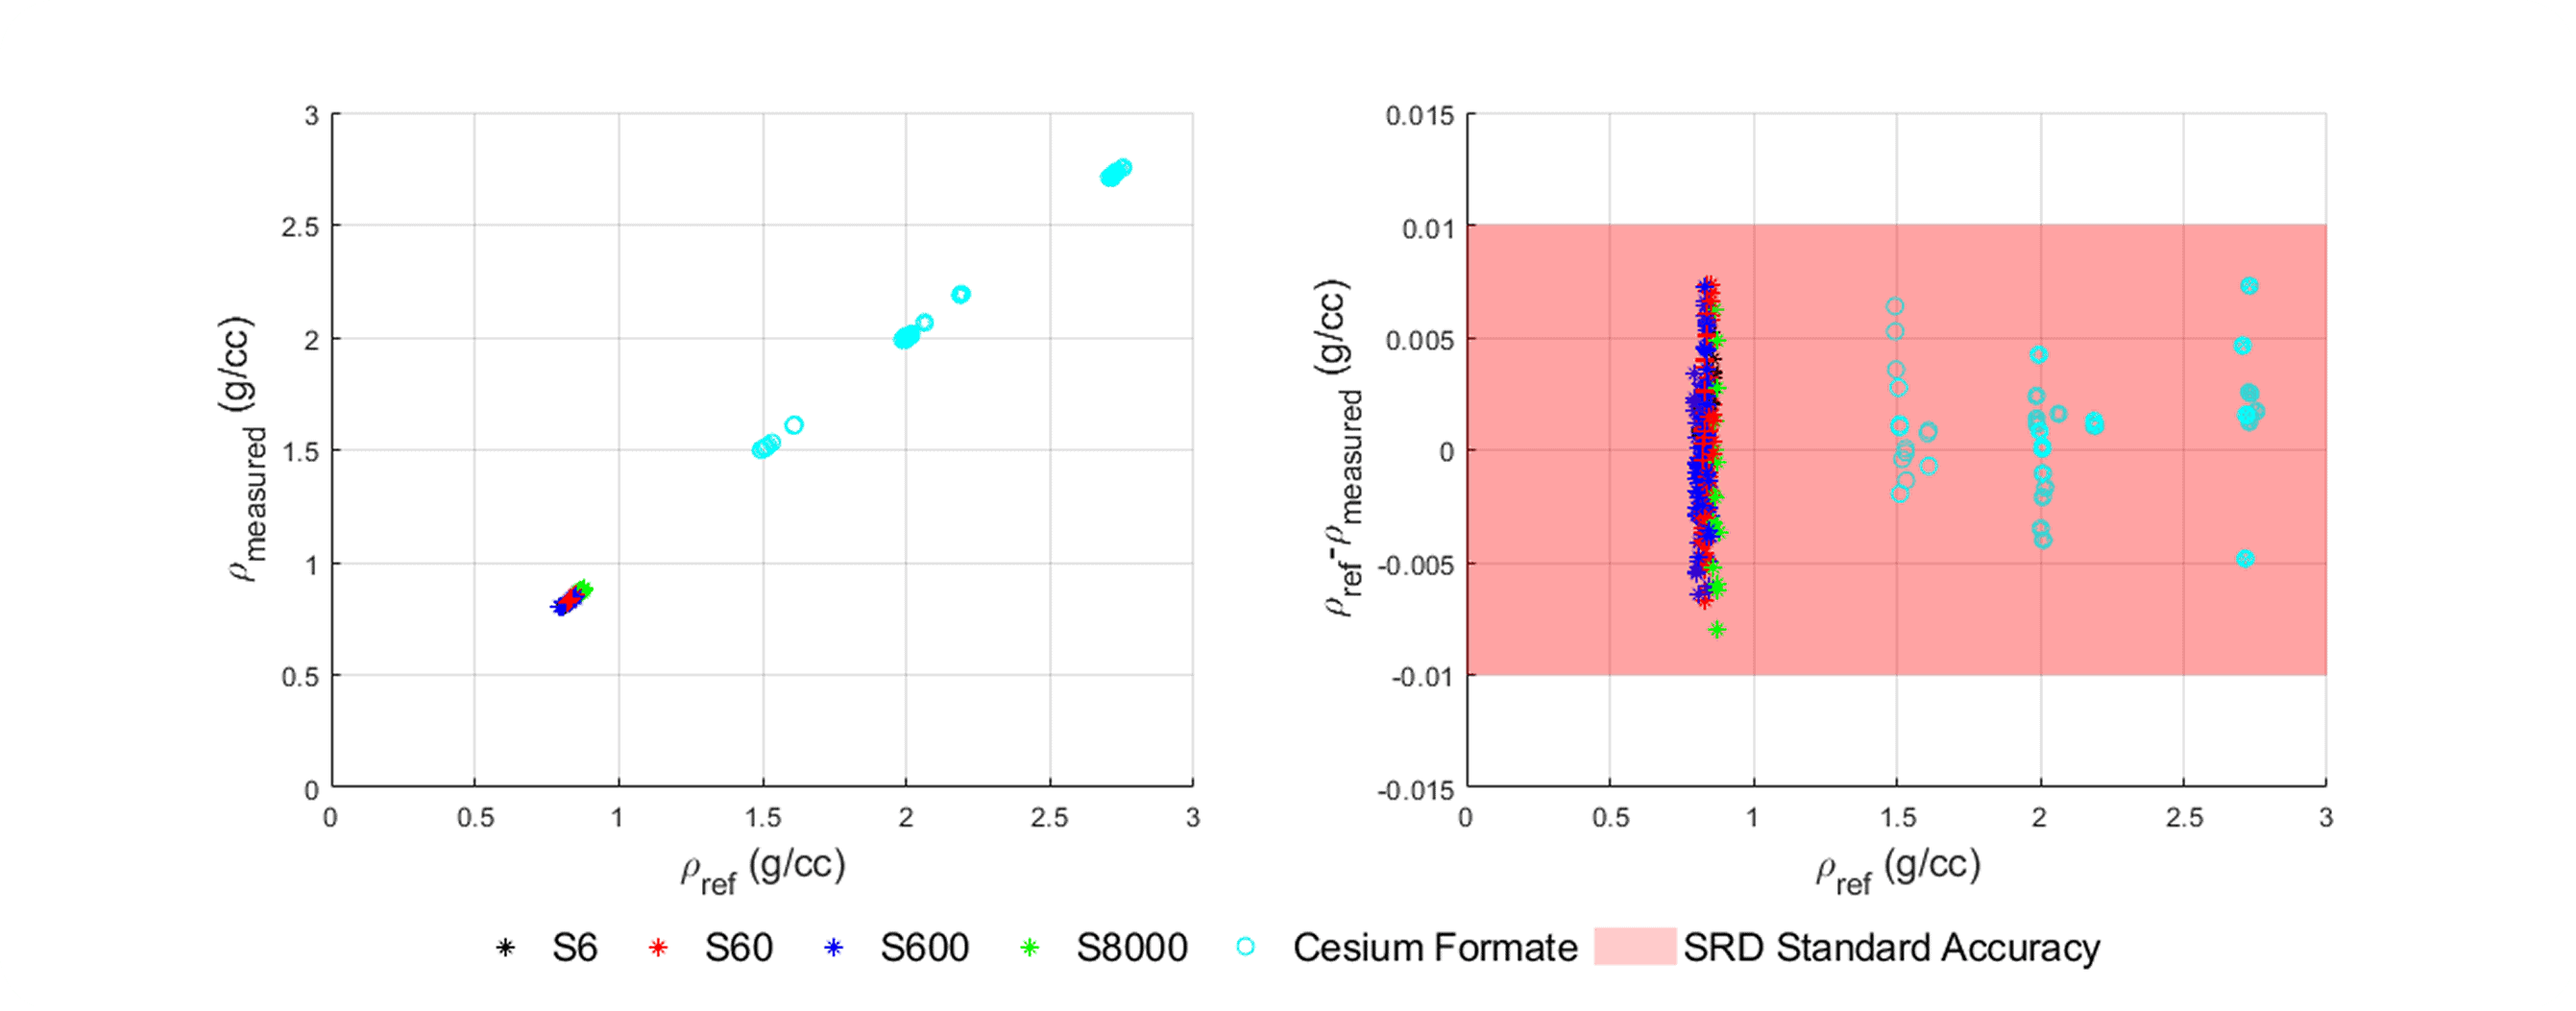
Measurements - SRD
- • Density Range 0.4-4.0 g/cc (0-4,000 kg/m3)
- • Viscosity Range 1 to 3,000 cP
- • Reproducibility Better than 1% of reading
- • Process Temperature -40 C to 300 C (-40 F to 575 F)
- • Pressure Rating Up to 500 bar (7500psi)
Sensor Implementation
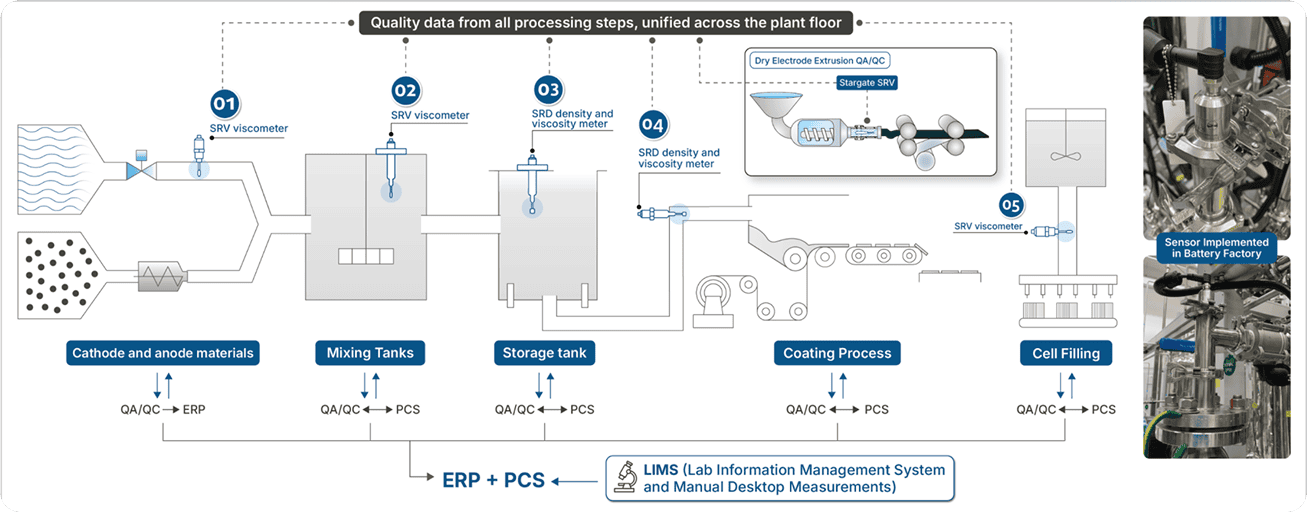

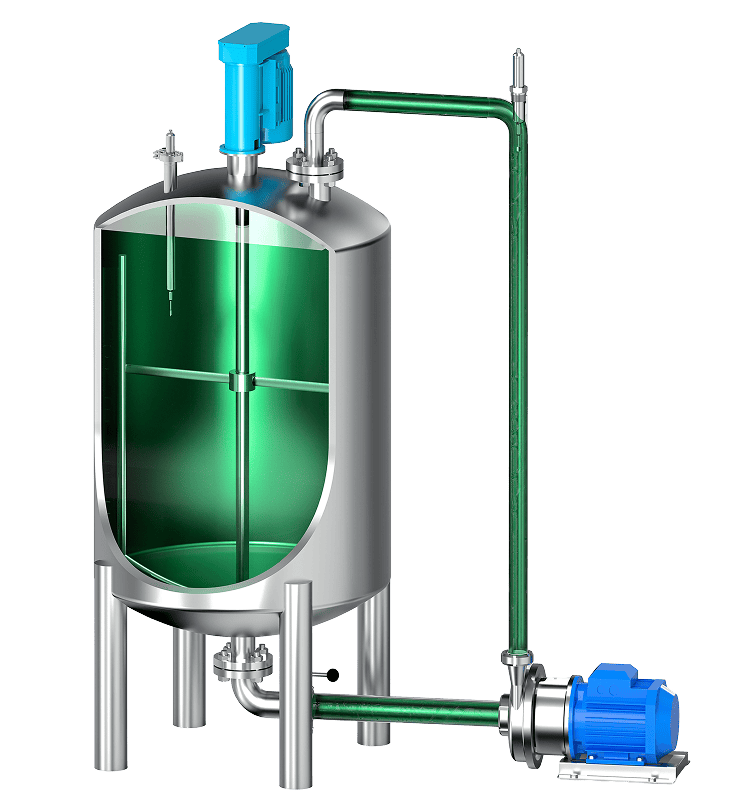
Recirculation line
SRD Density and viscosity meter

Tank Installation
SRV viscometer
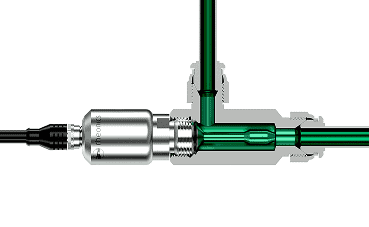
Coating line
SRV viscometer
Impact on KPI
Electrode slurry KPI
Viscosity
Homogeneity
Solid loading
Manufacturing Efficiency KPI
Mixing Time
Scrap Rate
Consistency
Cell Performance KPI
Coating Uniformity
Adhesion
Improved Electrode Slurry
Increased Manufacturing Yield
Enhanced Lifetime