Viscosity Standardization in Flexographic Printing
A new approach to controlling the largest variable in flexo and gravure printing
Introduction
In the history of our company we have applied every type of viscosity sensor: rotational, falling ball, falling piston and acoustic wave. The similarity between these sensors is that they are all calibrated with a cup, in our case the DIN cup with a 4 mm outlet. In itself this worked well and due to lack of a better alternative DIN cup 4 became the standard measurement in the flexo and gravure industry. In December 2017, when looking for a better solution, I came in contact with the Rheonics SRV as an alternative to the sensors we had been using, which were too inaccurate and insufficiently repeatable. In January 2018 we started testing two of these sensors and in June 2018 we equipped all 8 printing stations of the CI press with Rheonics SRVs. Last year we conducted many tests, gathering experience and new insights. We developed a formula to convert the unit centipoise, or mPaS, which is the unit delivered by the SRV, to DIN Cup 4 seconds because we were accustomed to working with these units. After a few months we decided to completely stop using the DIN Cup units, for reasons that will become clear in this article.
The current generation of printing machines are extremely accurate in terms of adjustment (in μm range) and have a very high degree of automation, such as a 100% inspection system, fully automatic impression setting of anilox rolls and plate cylinders, automatic register control and inline spectral colour measurement. However, the largest variable in the printing process, the viscosity of the ink, is still measured with a unit that is determined manually! In many cases even automatic viscosity controls are calibrated with a cup because operators are used to thinking in cup seconds. In practice, viscosity calibration is often not done because it is time consuming, or because the cups are dirty or not available.
The viscosity is a very important parameter in the final quality of the printed matter. If the viscosity is not correct, the flow behaviour and ink layer thickness will vary, which will lead to problems in print quality. In addition, poorly adjusted ink viscosity can lead to excessive ink consumption.
Accuracy
Every operator is used to working with some sort of viscosity measuring cup. These measurements have never been totally standardized and are only “reliable” over a relatively narrow measuring range with a large margin (5-10%) of error. Some of these errors are caused by the cup itself, others are a function of operator skill. Measurements are not repeatable. Temperature, which has a strong influence on viscosity, is difficult to control. Contamination of the cup and different densities of inks influence the run-out speed. All of these add up to poor repeatability and accuracy of DIN cup measurements.
In practice, error margins can be as high as 5-10% , which is a big bandwidth of viscosity. For example, for an ink has a viscosity of 20 s, an error margin between 5-10% means a bandwidth between 1 s and 2 s!
How does the accuracy and repeatability of the Rheonics SRV compare with DIN cup measurements?
Here is an excerpt from the Rheonics SRV specification sheet:
| Viscosity Range | 0.4 to 250,000+ cP |
| Viscosity Accuracy | 5% of reading (standard) 1% & higher accuracy available |
| Reproducibility | Better than 1% of reading |
| Temperature | Pt1000 (DIN EN 60751) |
| Process Fluid Temperature | -40 up to 300 °C (575°F) |
| Ambient Temperature | -40 up to 150 °C |
| Pressure Range | up to 7,500 psi (500 bar) |
The sensor’s operation is based on a vibrating element that is immersed in the fluid, and whose resonance is damped by the fluid’s viscosity. The Rheonics SRV differs from other vibrating sensors in that its resonator is completely balanced, making its accuracy immune to its mechanical environment. It is also extremely robust, meaning it can be cleaned, when necessary, by wiping it with a solvent-soaked rag.
The manufacturer’s specification shows that it has a broad measuring range and very high accuracy, but what does that mean in practice? We tested its accuracy by adding 20 g of solvent to 25 kg of ink. The sensor registered a viscosity change of 0.1 mPaS, which is the equivalent of a cup measurement difference of .02 seconds! This is a previously unknown accuracy of the measurement of viscosity in this industry. And because the SRV incorporates an accurate temperature measurement into the sensing element, it is possible to accurately compensate for the effects of temperature, as we will describe in the next section.
We have found that working with the cup is not only outdated, but actually counterproductive. After a few months we stopped converting to cup seconds altogether, finally elevating viscosity measurement, the last crucial variable in printing, to the same technological level as the rest of the process. We finally arrived in the 21st century.
Non-Newtonian behaviour, thixotropy, and temperature compensated viscosity
Due to the accuracy and repeatability of the Rheonics SRV sensor, we have gained a lot of insight into the behaviour of inks — sometimes more than we expected. Ink is a rheologically complex medium, and the SRV gives us some insight into that complexity that is not observable with the DIN cup.
Solvent based inks exhibit non-Newtonian behaviour. Under the influence of shearing force their viscosity changes. Ink is also thixotropic, a stationary ink having an appreciably different viscosity than an ink that is in motion. The viscosity of a stationary ink can differ from that of a moving ink by as much as 20%! And in addition, ink viscosity is strongly temperature dependent. On printing presses on which the temperature of the inks is not conditioned, ink temperature – and therefore viscosity – can vary greatly due to changes in the ambient temperature, but also due to the heat generation in the press itself. One of the first things that we have explored with the Rheonics SRV is the temperature dependency of ink viscosity.
We built a test set-up consisting of a closed flow loop in which the ink is continuously pumped in a circuit, at a speed comparable to that of the ink circuit in our press, and slowly heated up. Every second the temperature and viscosity are measured, giving more than a thousand measurement points in a typical test run.
The graph in Fig. 1 shows the temperature dependence of the viscosity of a number of different inks (modified nitrocellulose ink yellow, magenta, silver and a polyurethane white) over a temperature range of 20 °C. Over this range, the viscosity can differ by up to 60%.
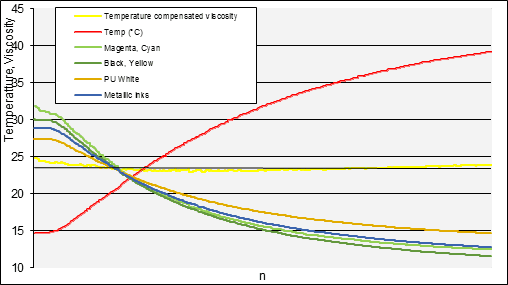
Figure 1. Temperature dependence of ink viscosity
One of the most important uses of viscosity measurement is to determine when and by how much ink must be diluted in order to compensate for loss of solvent during the printing process. Solvent evaporation increases the pigment loading of the ink, resulting in poor print quality and excess ink consumption. This loss of solvent also increases the viscosity of the ink. However, since viscosity is also a strong function of temperature, it is necessary to distinguish between the effects of temperature and evaporation in order to determine the amount and timing of solvent addition.
Without temperature compensation, an ink at a low temperature would give a high viscosity reading, suggesting that dilution is necessary. However, diluting the ink would give a lower color density, since the higher viscosity was due to lower temperature, not to higher pigment loading.
Using graphs such as those in Fig. 1, we developed an algorithm that allows us to compensate for the effect of temperature on the viscosity, resulting in a “temperature compensated viscosity” that is a true measure of the pigment loading. Therefore, it can be used directly to control solvent addition to make up for evaporation, because it removes temperature as a variable affecting the measurement.
Using our compensation algorithm, we reduce the error deviation to 1 % over the entire temperature range. In the automatic viscosity control the temperature compensation can be selected for each type of ink. We have determined this curve for almost every ink we use, and have determined the temperature compensation parameters using our special algorithm, enabling us to finally achieve tighter control over pigment loading and its effect on printing quality.
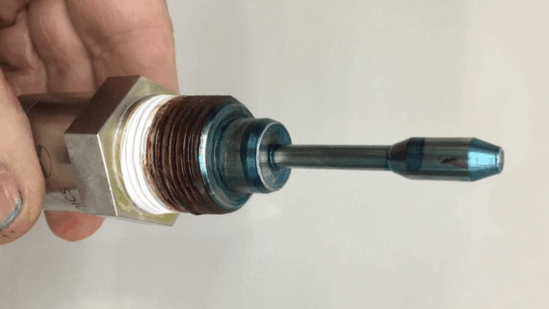
Figure 2. The SRV sensor after measurement in cyan ink
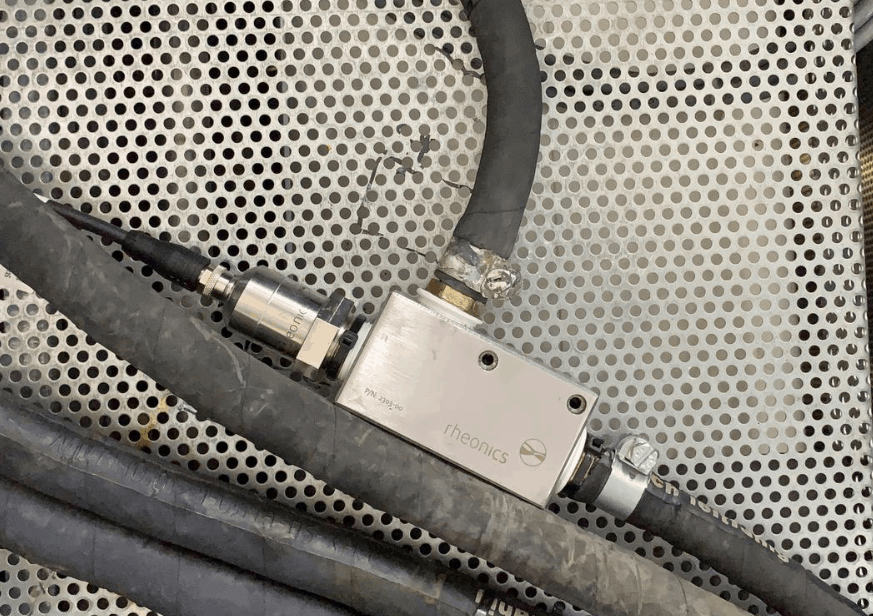
Figure 3. SRV installed in ink line, showing Rheonics printing adapter
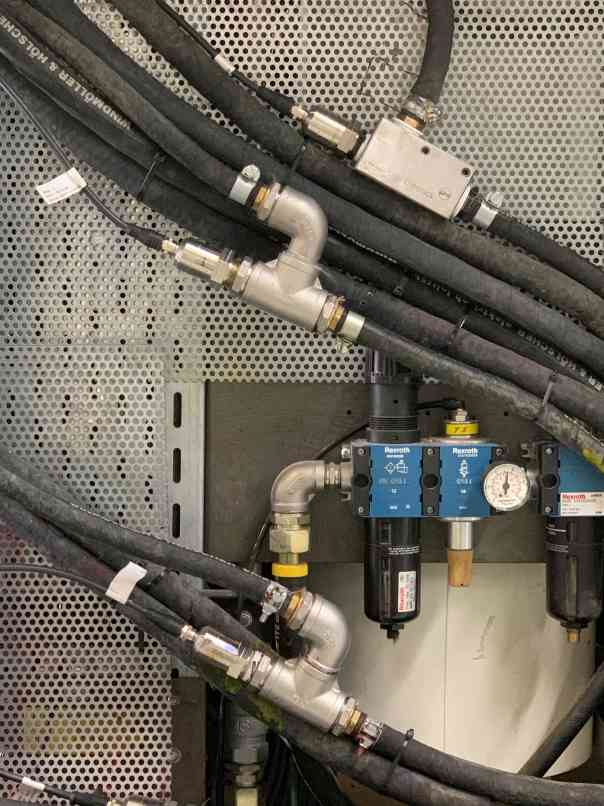
Figure 4. Four SRVs installed on a press, using simple pipe tees as adapters
Installation
The sensor is mounted in a connector with an inlet and outlet opening and installed in the supply line between the ink pump and the doctor chamber. Influences such as machine vibrations or pressure pulsations from the diaphragm pump have no effect on sensor operation or measurement accuracy.
The sensor is maintenance-free – each cleaning cycle of the lines and doctor chamber ensure that the sensor is clean again, since it is automatically washed in solvent. As shown in Fig. 2, only a very thin haze of color may remain on the sensor, which has no influence on its accuracy or repeatability. And because of the sensor’s robust construction, any necessary cleaning can be done with a solvent-soaked rag, with no danger of damaging the sensor or changing its calibration.
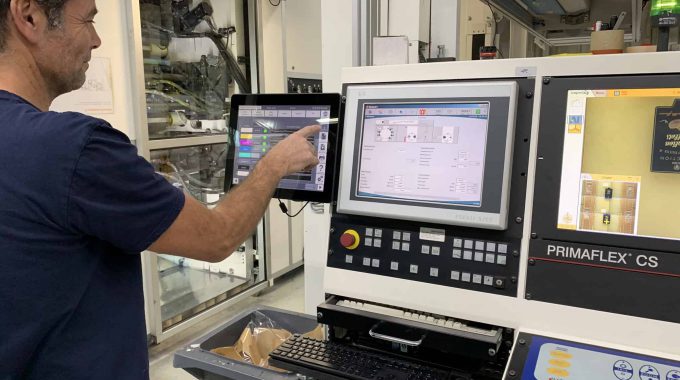
All sensors are separately connected via industrial grade cables to their electronics units, and these communicate with an industrial grade pc. The computer controls a valve island, which in turn controls the pneumatically-actuated valves for dosing solvent. The system includes a touchscreen, next to the operator control panel, which operates the intuitive user interface of the Rheonics viscosity control software, Inksight. In the creation of the user interface it was obvious that it had to be clear, intuitive, effective and quick to operate. The interface displays a dashboard, on which the operator can monitor the viscosity of all stations. Touch-sensitive controls enable the operator to switch individual stations on or off, enable automatic control, and to set the viscosity limits. A separate station hub switches to a display that monitors the viscosity over time and allows adjustment of specific sensor and valves.
Furthermore, the software notifies the operator when the viscosity changes are too large and helps by making the right correction to solve the problem.
Automatic control, CS-Control
During printing there is continuous evaporation of solvents; evaporation increases with increasing printing speed and rising ink temperature. The SRV sensors measure the actual value of the viscosity and ink temperature once a second, enabling the software to calculate the temperature compensated viscosity. This, in turn, enables the controller to determine whether the temperature compensated viscosity falls within the desired tolerance. The controller will add a quantity of solvent that depends on the size of the deviation from the setpoint. During printing, it is possible to maintain a deviation only 0.5 % from the set point. Special dosing valves are used that can add the very small amounts of solvent that are necessary to achieve such fine control. The plots below are of the same colour with different scales, with vertical magenta lines indicating automatic solvent dosing.
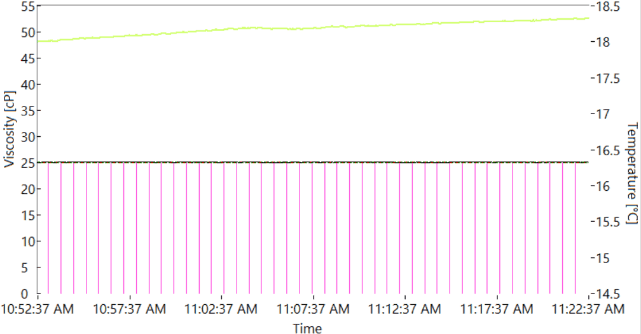
Figure 5a. Temperature compensated viscosity and temperature vs. time, coarse vertical scale
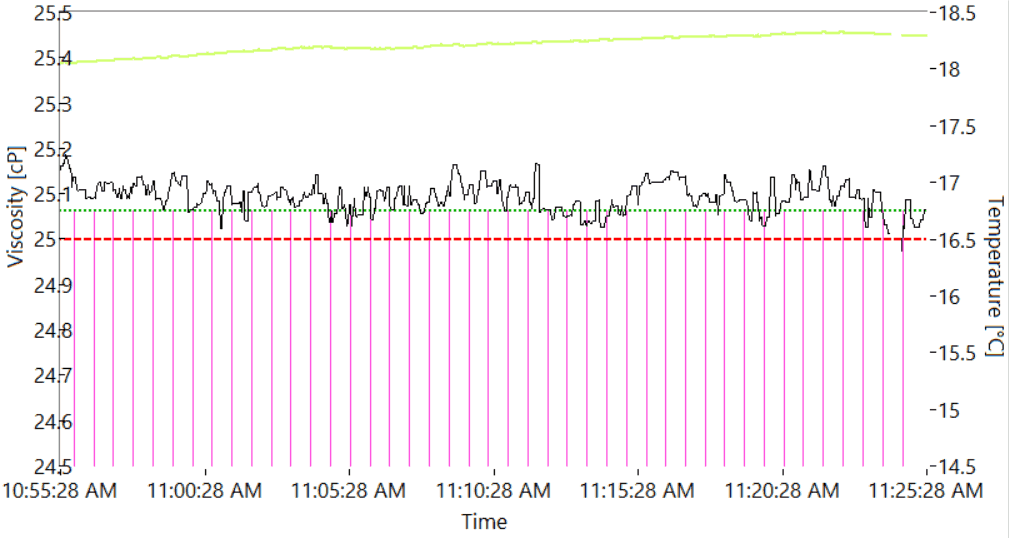
Figure 6b. Same plot as above, with expanded vertical scale. Temperature compensated viscosity variation is less than 0.2 mPaS
The SRV-based control system is extremely accurate because it can compensate rapidly and often for the evaporation that is occurring constantly during the printing process. To achieve such very small deviations from the setpoint, the system will sometimes dose as little as 10 g of solvent every thirty seconds.
If an ink with too high a viscosity is added to the ink bucket, the control responds immediately by measuring the response at each solvent dose, with the subsequent dosing of solvent being adjusted accordingly. In the end, the set point is reached very gradually with very little overshoot. Besides the extreme accurate control, it’s possible to keep the viscosity stable when the level in the ink bucket is very low, just enough to pump the ink through the system.
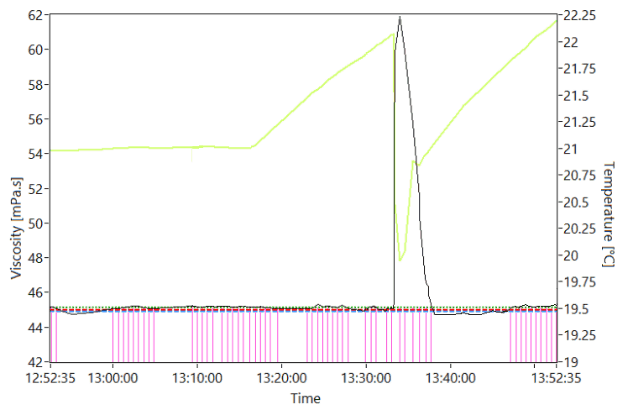
Figure 6. Response of the system to adding a large volume of cool ink to a system running at 21 deg. C. Note the rapid recovery time of the temperature compensated viscosity.
Quality assurance, improvement and standardization
An experienced operator knows what viscosity must be maintained for which types of ink in the particular process being used. This depends on the kind of ink – the Pantone color as well as special challenges, such as those presented by metallic and white inks, which have a somewhat different behaviour with temperature than “normal” inks. And the desired viscosity also depends on the type of substrate on which the printing is done.
To better understand the problem and its solution, we performed a series of experiments on the effects of ink dilution on print quality and measured ink viscosity. With these results we now which viscosities have to be maintained for the type of substrate (paper, polyester, polyethylene, polypropylene).
In a first experiment 10 kg ink was 10% diluted, press running at 200 meters/min, the polyester film was marked and the press was stopped. The ink was diluted with a further 3% of solvent, the ink was circulated until the viscosity stabilized and the process was repeated a total of 15 times. The film was removed, and all 15 segments were measured with a spectrophotometer, and photographs of the film segments were made for subjective visual evaluation.
The following composite figure shows the visual appearance of the printing quality at a series of dilutions.
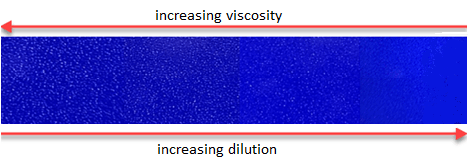
Figure 7. Color density variation with ink dilution and viscosity
At the lowest dilution (highest viscosity), too much ink is deposited and does not flow properly. Pinholes develop, and overall quality is poor. Although the colour between the pinoles is quite dense, the measured density is low, due to the high reflectivity of the pinholes. As dilution increases, viscosity decreases and the flow improves, but pigment loading decreases and the colour becomes lighter. Each sample was measured with the spectrophotometer and compared with the digital PMS reference. The following chart and table show the dE2000 and color density as functions of dilution and viscosity. Viscosity difference values are referred to sample 6, which is the target density.
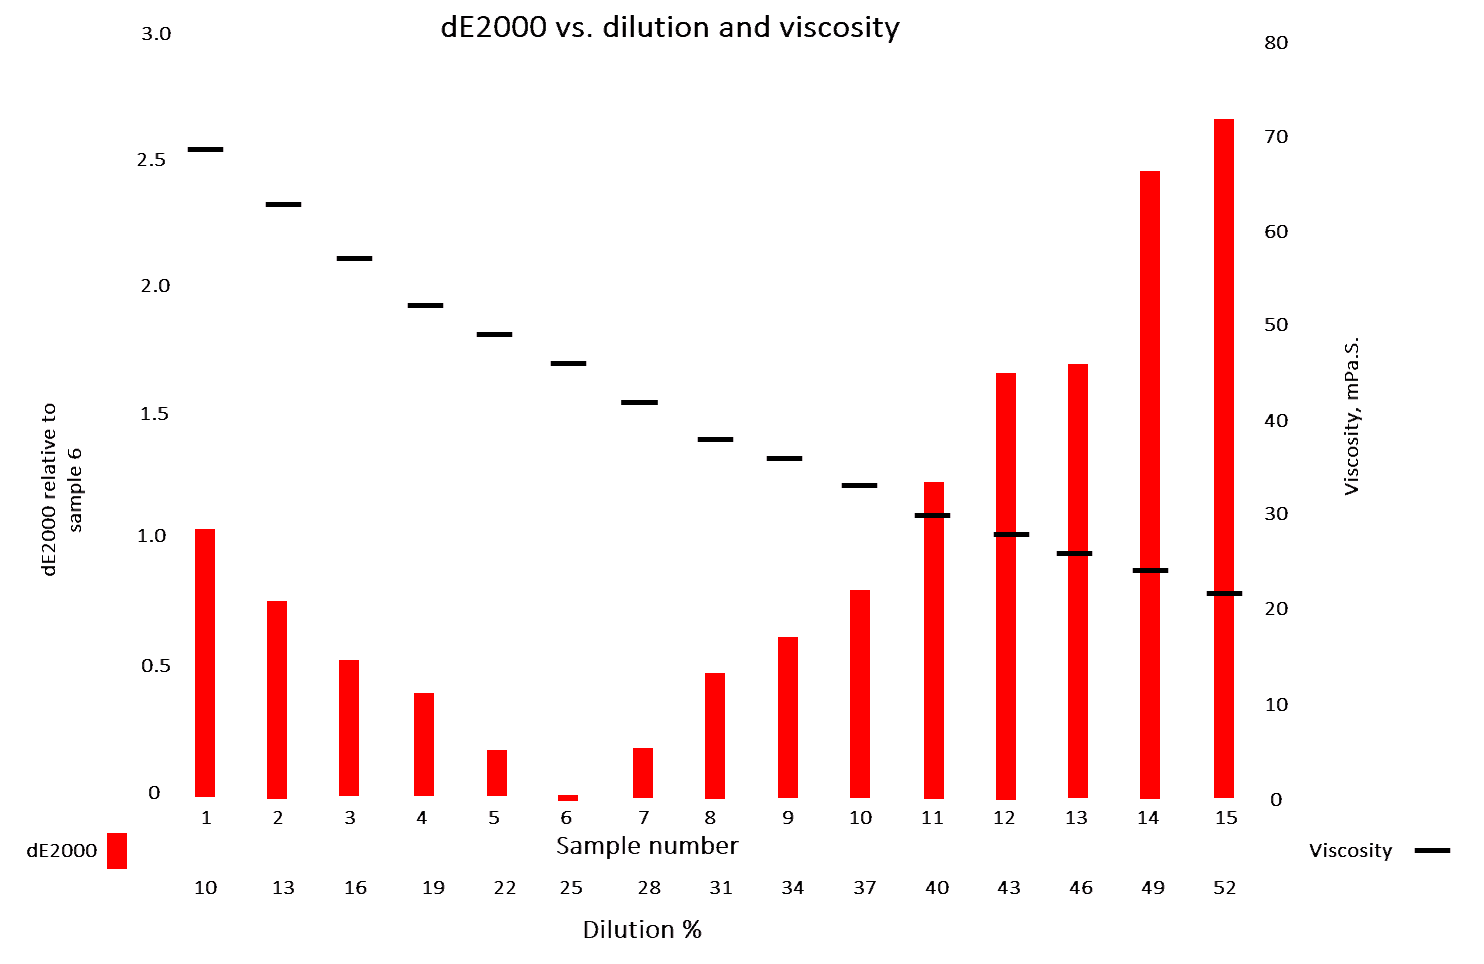
Figure 8. Color density as a function of ink dilution and density. dE2000 values are referred to sample 6
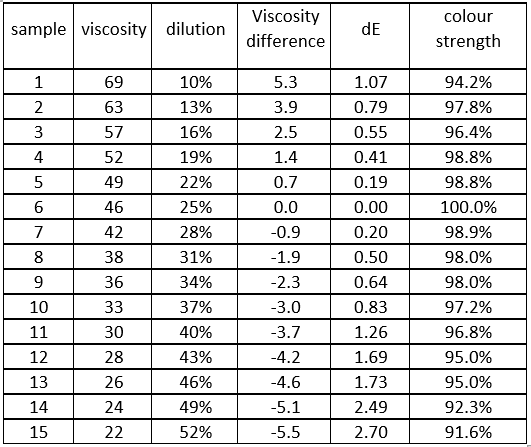
Table-1. Numerical values of dE2000 and color strength vs. dilution. Viscosity difference is relative to Sample 6
This experiment shows that with the Rheonics system, very accurate viscosity control can be achieved, with a viscosity bandwidth of 0.5%. By dosing of very small quantities of solvent about every 30 seconds, the system enables very small variations in dE values to be achieved.
At the time these experiments were done, the customary viscosity bandwidth was ± 0.5 cup seconds (about ± 2.2 mPaS) with the viscosity being checked every 5-10 minutes. The amount of solvent that was then dosed was between 0.2 and 0.5 kg (depending on the ink coverage, type of solvent, anilox volume, machine speed and temperature.
We now have changed the process of printing a Pantone colour, because we not only know which viscosities have to be maintained for the type of substrate, but can hold tight tolerances on this viscosity. Certain substrates require a higher viscosity due to the fact that the ink “sinks” too far and so the structure becomes visible, resulting in a decrease in colour strength, while other substrates need a lower viscosity due to their smooth surface and good ink acceptance. With the experience gained with the Rheonics sensor, we know exactly which viscosity should be maintained for the type of substrate (polyethylene, polypropylene, polyamide, polyester, paper, and biodegradable), and have actually determined a standardization for ourselves.
With the very first print, the colour density of the pantone colour is measured and then the operator checks whether the ink has the correct viscosity for the relevant substrate. (The ink is usually not brought to the correct value in advance because the substrate may vary slightly in terms of surface quality, so we have some room to play with the viscosity for optimum results).
In the older method, if a colour had too high colour density, we reduced it with varnish and/or with a different anilox roll. If in doubt, the viscosity was checked with a cup, which usually necessitated re-calibration of the relevant sensor.
Because we now have a more reliable measure for the initial temperature compensated viscosity of the ink, its viscosity can immediately be adjusted automatically by diluting an ink to the correct value. Because the correct viscosity values are maintained, this leads to better ink transfer from anilox roll to printing plate and finally to the substrate. Contamination of the anilox roll can also be noticed earlier because we know which colour strength should be reached with a certain viscosity.
Too high viscosity leads to poor transfer resulting in visual characteristics like opacity and “ghosting”. Due to a more accurate viscosity, the cell of the anilox roll is better emptied and the ink usually flows better, giving in a smoother ink layer and increased colour strength. With increasing speed, the ink transfer decreases, but because the ink has the correct viscosity and performs optimally, these variations are smaller compared to our earlier method using cup calibrated sensors.
In the last six months we have improved colour quality and are able to maintain much smaller deviations of dE2000 values, especially. A result of tighter viscosity control is that the print inspection system sees far fewer errors in colour strength deviations. Our operators have complete confidence in the accurate and repeatable values of the sensors and control system. This trust has led to our press achieving excellent print quality for jobs small and large. In addition, we have performed neither maintenance nor calibration of the sensors and beyond our initial temperature compensated viscosity parameter measurements for each ink, no further standardization of the viscosity values needs to be done. We now know what viscosities should be maintained for specific substrates. After printing each new order, we store the viscosity set values and use these for repeat orders of the same job.
A deviation of 5% applies to one color and not to the other, I think it is better to state that we can maintain the dE values much better during the printing of an order and keep the value within a much smaller bandwidth of the initial value.
So why not convert to cup seconds?
Although formulas exist to convert viscosity values from mPaS to DIN cup seconds, we have found that abandoning cup-seconds has several advantages.
Above all, it has changed the way we think about viscosity. As long as we thought in terms of cup seconds, keeping a tight control on viscosity seemed like an impossible task. Our expectations were limited by our previous experiences, so we set the bar lower than was necessary to achieve the kind of print quality we knew was attainable.
Furthermore, thinking in terms of cup seconds made us want to grab a cup and check the accuracy of these new sensors, with which we were unfamiliar at the time. But checking the accuracy of the sensors with a much-less-repeatable method can give the false impression that the sensors themselves are not repeatable! It is only when we compared actual printing results using the new sensor system to what we were accustomed to that we saw the real value in thinking in the new, unfamiliar units. It enabled us to “think small”, to be able to see small variations in viscosity that were otherwise invisible. Furthermore, it let us get our viscosity under tighter control, which had direct positive impact on the quality of our final product, which is, after all, our main goal.
As printing speeds increase, and profit margins get tighter, “getting it right the first time” becomes much more important. An error in initial viscosity setting can result in producing several thousand meters of waste in no time at all. With the Rheonics SRV system, we have been able to streamline our printing process while improving color quality and reducing waste.
In the next article in this series
In this article we have focused on the basic challenge of viscosity monitoring and control, showing the benefit of tight control for print quality and ink economy. In the next article, we will look more closely at the control system that make it possible for the press operator to achieve and maintain this quality with a minimum of intervention. The system, Rheonics Printing Solution (RPS), consists of a control box containing a process computer and valve control that directly controls solvent dilution based on measured viscosity. The RPS can accommodate up to 10 printing stations, with SRV sensors doing the monitoring. The RPS hardware is supported by a sophisticated software system that estimates the required dilution based on measured viscosity and is controlled by a simple and intuitive user interface to set and adjust the desired viscosity.
We will also consider the challenge of viscosity control of special inks, such as UV inks whose viscosity is very temperature sensitive, and whose viscosity is best controlled through thermal controls.