Sensors and Measuring Systems 2014; 17. ITG/GMA Symposium – A New Sensor for Viscosity and Fluid Density Measurement for Oil Well Drilling Applications
Overview
A conference paper was published and a talk was delivered in Sensors and Measuring Systems 2014; 17. ITG/GMA Symposium, titled “A New Sensor for Viscosity and Fluid Density Measurement for Oil Well Drilling Applications” in June 2014.
It covers some of the R&D work carried out by Rheonics (formerly Viscoteers) in collaboration with Baker Hughes to develop a density & viscosity sensor that measures formation fluid properties with high accuracy and resolution.
Abstract
This paper describes a novel density and viscosity sensor that measures properties of formation fluids with high accuracy and resolution. Dynamic viscosity (ri) in combination with other fluid parameters such as density (p), sound speed, refractive index, absorption spectra and thermal conductivity provide a comprehensive characterization of the sample fluid. Estimating the formation permeability is critical for predicting the reservoir’s production potential. Mobility measurements performed on the formation using various downhole sampling tools can be used to calculate the permeability of the formation when accurate in-situ viscosity of the formation fluids is known.
The sample fluid may be any combination of various molecular weight hydrocarbons, brine, oil- or water-based mud filtrate and gases. and the fluids typically have a viscosity in the range of 0.5 to 4 cP (mPa.s) but may be as high as 40 cP in heavy oils. Fluid density can range from 0.2 up to 1.5 g/cc. In addition, the fluids also may be conductive, and they can have partially non-Newtonian properties.
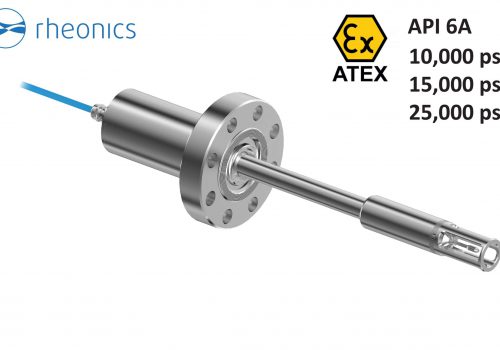
For a sensor to be useable in a downhole formation sample and analysis tool, it must therefore have a large dyamic range with accuracy better than 10% of reading. It must also be capable of measuring at temperatures up to 175°C and pressures exceeding 25 kpsi.
In this paper, a new sensor is described that can meet all these requirements. It is a driven mechanical resonator whose resonant frequency and damping yield accurate values for the viscosity and density of a fluid in which it is immersed. The sensor was designed to be both highly accurate and sufficiently robust to withstand the temperature, pressure and drilling vibrations encountered in downhole logging. Viscosity is measured to within 0.1 cP for fluids less than 1 cP and 10% for all viscosities above 1 cP.. Density measurements are accurate to better than 0.01 g/cc. The sensor can be used for both wireline and logging-while-drilling (LWD) tools.
The paper presents the measurement principles of the sensor and high-temperature and high-pressure qualification tests. The laboratory measurements of viscosity and fluid density conducted with the new sensor are shown for a variety of calibration fluids that are typical of downhole fluids collected by formation sampling tools.
1. Introduction
Various sensors for in-situ measurement of viscosity and density have been implemented for wireline and LWD formation evaluation services. In 2008, Baker Hughes introduced a piezoelectric tuning fork [6] that measures fluid density in the range of 0.01 to 1.5 g/cc with an RMSE
± 0.015 g/cc for viscosities lower than 30cP; and RMSE ± 0.03 g/cc for viscosities between 30cP and 200cP. The viscosity measurement range for this sensor is 0.2 to 30 cP with an RMSE ± 0.1 cP or 10% (whichever is larger) and between 30 and 200 cP with an RMSE ±20%.
This sensor was developed initially for wireline applications, but, in 2010 was adapted for LWD tools. At the same time Baker Hughes in cooperation with Viscoteers Inc. began developing a new sensor technology tailored for the highly demanding drilling environment, meeting and exceeding the measurement capabilities of its predecessor.
2. Sensor description
The new sensor is a highly precise torsional resonator [3] that changes its characteristics — resonant frequency and damping — depending on the density and viscosity of the fluid in which the sensor is immersed. (Fig. 1).
The resonator is excited and sensed wirelessly by magnetic coupling between electrical coils outside the sensing chamber and magnets embedded in the tine heads of the resonator [3] (Fig. 2). The resonator is made of high- strength, highly corrosion resistant and well characterized metal, whose properties remain stable under high temperature and high ambient pressure. This configuration avoids electrical feedthroughs to the high pressure fluid side, which are a notorious source of failure in sensors requiring electrical connections across the pressure barrier. Because the resonator is made entirely of metal, the sensor is extremely robust and suitable for the harsh envi- ronment in downhole drilling conditions.

Fig 1. Amplitude and phase resonator response curves arrount resonance frequency of the sensor inmersed in two fluids with different damping. Graphic from Good- bread et al, 20013.
The resonator is excited and sensed wirelessly by magnetic coupling between electrical coils outside the sensing chamber and magnets embedded in the tine heads of the resonator [3] (Fig. 2). The resonator is made of high- strength, highly corrosion resistant and well characterized metal, whose properties remain stable under high temper- ature and high ambient pressure. This configuration avoids electrical feedthroughs to the high pressure fluid side, which are a notorious source of failure in sensors requiring electrical connections across the pressure barrier. Because the resonator is made entirely of metal, the sensor is extremely robust and suitable for the harsh environment in downhole drilling conditions.
The mechanical oscillator has a high Q-factor, which is a prerequisite for a large dynamic range of the damping measurements.
The two values measured by the sensor, resonance frequency and damping, are correlated to values of viscosity and density by means of a mathematical model as wekk as by an empirical calibration curve built for each sensor. Both of the methods provide extremely accurate and repeatable results (see sensor specification), but because the empirical calibration method is less computationally expensive, and is less susceptible to variation in the sensor shape it is the preferred method.
The resonator is excited by coils driven by an AC-current that vary in frequency as the measurement requires it. The response of the sensor is sensed by additional windings on the coils. The entire viscosity and density measurement takes about 1s, which is a significant improvement over previous technologies, because it can be performed while the pressure is constant in the pump’s draw-down period.

Fig. 2. Viscosity-Density Sensor coupled torsional reso- nator concept. Graphic from Goodbread et al, 20013.
The sensor (Fig. 3) not only withstands extremely high pressure and temperature, (lab tested at 2000 bar and 200 °C), but is also immune to damage by shocks up to 750 g, and continuous vibration to 30g.

Fig. 3. Viscosity-Density sensor module design
The sensor is controlled by a phase locked loop that tracks and monitors its resonant frequency in order to measure fluid density. By periodically changing the phase relationship between the excitation and the sensor’s re- sponse, the damping of the resonator, from which the vis- cosity can be estimated may be determined as shown in Fig 4.

Fig. 4. Phase shift method to calculate the damping of a fluid. Graphic from Goodbread et al, 20013.
3. Sensor specifications
The specifications were verified against the tested proper- ties of manufactured sensors. The sensor is capable of measuring sample fluids of any combination of various molecular weight hydrocarbons, brine, oil- or water-based mud filtrate and gases.
The huge dynamic range of the sensor can be appreciated by comparing its specifications with those of standard in- dustrial fluid density and viscosity measurement systems.

Table 1. Density Viscosity Sensor Specifications
4. Sensor testing under laboratory conditions
The sensor was tested at various pressures and temperatures with several selected fluids to cover the viscosity and density range of fluids encountered downhole.
The test results verify the accuracy and precision of the measurement in the required range of fluids. The fluids used were:
- Brine with a concentration of 2 mol of NaCl per liter of water,
- N-dodecane
- Viscosity standard oil Cannon® S-20, N-2, N- 10, N-35, N-75, S-6.
These fluids were chosen because:
- Accurate reference values for their properties are available
- their range of viscosity and density encompasses the sensor’s range
- their physical properties provide a representative sample of the fluids encounter downhole (i.e. water and oil base, conductive and nonconduc- tive fluids)
Fig. 5 shows the density measurement range and accuracy achieved with the sensor for different fluids.
, N-dodecane, Cannon S-6, N-2, N-10, N-3, N-75 and chloroform")
Fig. 5. Measured density of brine (2mol/l), N-dodecane, Cannon S-6, N-2, N-10, N-3, N-75 and chloroform. The solid black and red lines represent the maximum and minimum allow values prescribed by the sensor specifications.
Fig. 6 and 7 show the viscosity measurement range and accuracy achieved with the sensor for different fluids covering most of the range of the specifications.
, N-dodecane, Cannon S-6, N-2, N-10, N-35 and N-75")
Fig. 6. Measured viscosity in the upper range of brine (2mol/l), N-dodecane, Cannon S-6, N-2, N-10, N-35 and N-75. The solid black and red lines represent the maxi- mum and minimum allow values prescribed by the sensor specifications.
, N-dodecane, Cannon S-6, N-2, N-10, N-35 and N-75")
Fig. 7. Measured viscosity in lower range of brine (2mol/l), N-dodecane, Cannon S-6, N-2, N-10, N-35 and N-75. The solid black and red lines represent the maximum and minimum allow values prescribed by the sensor specifications.
4.1 Details of accuracy and precision of the measurements using N-dodecane
N-dodecane was selected for detailed testing because of availability of the availability of accurate reference up to high pressures (1900 bar) and high temperatures (200°C).
Fig. 8 and 9 show the viscosity measurement behavior with respect to changes in pressure (1 to 1500 bar). The values follow the reference viscosity with an error lower than 5% of the readings. At each pressure-temperature condition, 50 measurement points are taken, (Fig. 9).
Fig. 9 provides a graphical display of the absolute error (distance from the 0 line) and the precision (variation of the cloud of points for each temperature-pressure measurements), which is better than 0.5% of the reading.

Fig. 8. N-dodecane viscosity at 50°C between 1 and 1,500 bar. Reference values from Caudwell et al, 2008.
 at 50°C, between 1 and 1,500 bar")
Fig. 9. N-dodecane viscosity-measured errors (with re- spect to reference) at 50°C, between 1 and 1,500 bar. Reference values from Caudwell et al, 2008.
Fig. 10 and 11 show the density measurement behavior with respect to changes in pressure (1 to1,500bar). The measured density comprises an accuracy of better than +/- 0.003 g/cc.

Fig. 10. N-dodecane density at 50°C between 1 and 1,500 bar. Reference values from Caudwell et al, 2008.
 at 50°C, between 1 and 1,500 bar")
Fig. 11. N-dodecane density-measured errors (with re- spect to reference) at 50°C, between 1 and 1,500 bar. Reference values from Caudwell et al, 2008.
The calculated minimum precision from the last two graphics is better than 0.1% of the reading.
5. Conclusions
The new density and viscosity sensor, designed for the demanding LWD environment, performed better than the target specifications during lab tests. The result obtained for the three fluids presented in this paper verifies that:
- The sensor does not show any measurement bias with changes in pressure and
- The precision of the sensor for all fluids presented in the paper is better than +/- 0.001 g/cc for density and better than +/- 1% for viscosity.
- Density accuracy of the sensor in all tests performed is better than 0.01 g/cc. Viscosity accuracy is better than 10% of the reading for viscosities larger than 1 mPa.s and better than 0.1 mPa.s for viscosities lower than 1 mPa.s.
- The sensor does not exhibit any damage or changes in the measurement behaviour after shock and vibration testing to specifications.
- The sensor produces stable measurements during and after all temperature and pressure cycling
- There was no evidence of mechanical or corrosion damage to the sensor after all the sensor after all the tests.
- The new sensor is robust enough to withstand the harsh environment conditions of the LWD and wire- line services, providing viscosities and densities with the accuracy and precision necessary for a downhole formation evaluation analysis tool.
- The sensor performs well in conductive (brine) or non-conductive fluids, showing no sign of influence when testing in conductive fluids.
6. References
- Caudwell Derek R. , Trusler J. P. Martin , Vesovic Velisa , Wakeham William A., 2004, The Viscosity and Density of n-Dodecane and n-Octadecane at Pressures up to 200MPa and Temperatures up to 473 K., International Journal of Thermophysics 08/2004.
- Galvan Sanchez Francisco, Baker Hughes, 2013, Sampling While Drilling Goes Where Wireline Can’t: Case Studies Illustrating Wireline Quality Measurements in Challenging Borehole Environ- ments, SPE-164293.
- Goodbread Joe, Juerg Dual, Viscoteers Inc, 2013, Coupled torsional resonator viscometer, EP2596328 A2.
- Kestin Joseph, Khalifa Ezzat H., and Correia Robert J., 1981, Tables of the Dynamic and Kinematic Vis- cosity of aqueous NaCl solutions in the temperature range 20-150°C and the pressure range 1-35 MPa, Phys. Chem. Ref. Data, Vol. 10, No.1 1981.
- Lundstrum Robbi, Goodwin Antony R. H., Hsu Kai, Frels Michael, Caudwell Derek R., Trusler J. P. Mar- tin, and Marsh Kenneth N., 2005, Measurement of viscosity and density of two reference fluids, with nominal viscosity at T= 298 K and p=0.1 MPa of (16 and 29) mPa.s, at temperatures between (298 and 393) K and pressures below 55MPa, J. Chem. Eng. Data 2005, 50, 1377 – 1388.
- Rocco DiFoggio, Arnold Walkow, Paul Bergren, Baker Hughes Inc, 2007, Method and apparatus for downhole fluid characterization using flexural me- chanical resonators, US Patents 7,162,918 B2.
- Rogers P. S. Z., and Pitzer Kenneth S., 1982, Volu- metric properties of aqueous Sodium Chloride solu- tions, J. Phys. Chem. Ref. Data, Vol. 11, No.1 1982.
Rheonics Solutions for the Oil and Gas Industry
To explore more about our solutions for energy industry, please visit the solutions page.
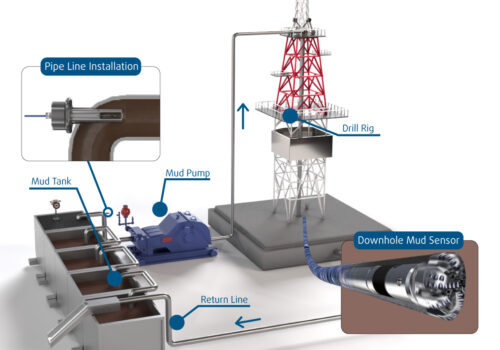
Drilling mud density and viscosity are critical parameters that directly influence drilling performance, borehole stability, and operational safety. Density, or mud weight, is the primary variable for controlling hydrostatic pressure…

Density and Concentration are critical parameters in Brine Lithium Extraction process for monitoring and control concentration, purity level, and process optimization. Inline monitoring of these parameters is key for a…
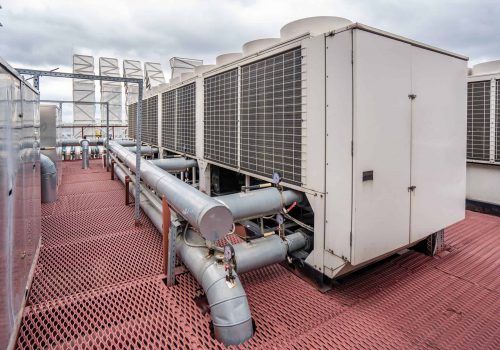
Fluid cooling systems are an essential component in data center technology. As the power density of data center processors increases, coolant performance becomes a critical link in the reliability and…
The ability to monitor the level of sand in desanders, separators, and flowback systems allows for automation and higher efficiency of sand removal processes and improved usage and lifetime of…
For process engineers, it's essential to develop an efficient and reliable method to monitor and control the milk of lime slurry in the production of the target product. The key…
Slurry is a mixture of liquid and solid materials, that can have a fluid- or solid-like behavior depending on the percentage of the materials that compose it. This term is…
Globally, the LNG market has expanded at a significant rate in the last decade, and LNG has considerable environmental benefits as a transport fuel. Traders trade LNG on the basis…
Asphalt has proven itself to be one of the most versatile and effective materials for paving – be it road or roof. Ensuring that asphalt meets regulatory norms like ASTM,…
Related Blog Content